Hi there,

Hope anyone can help me.

How is it possible that there are less people who completed the funnel when I increase the range in which users can complete it?

I would expect to have more or at least the same amount of users in the 30 day range funnel, since we’ve given users more time to convert.


Completed within 7 days
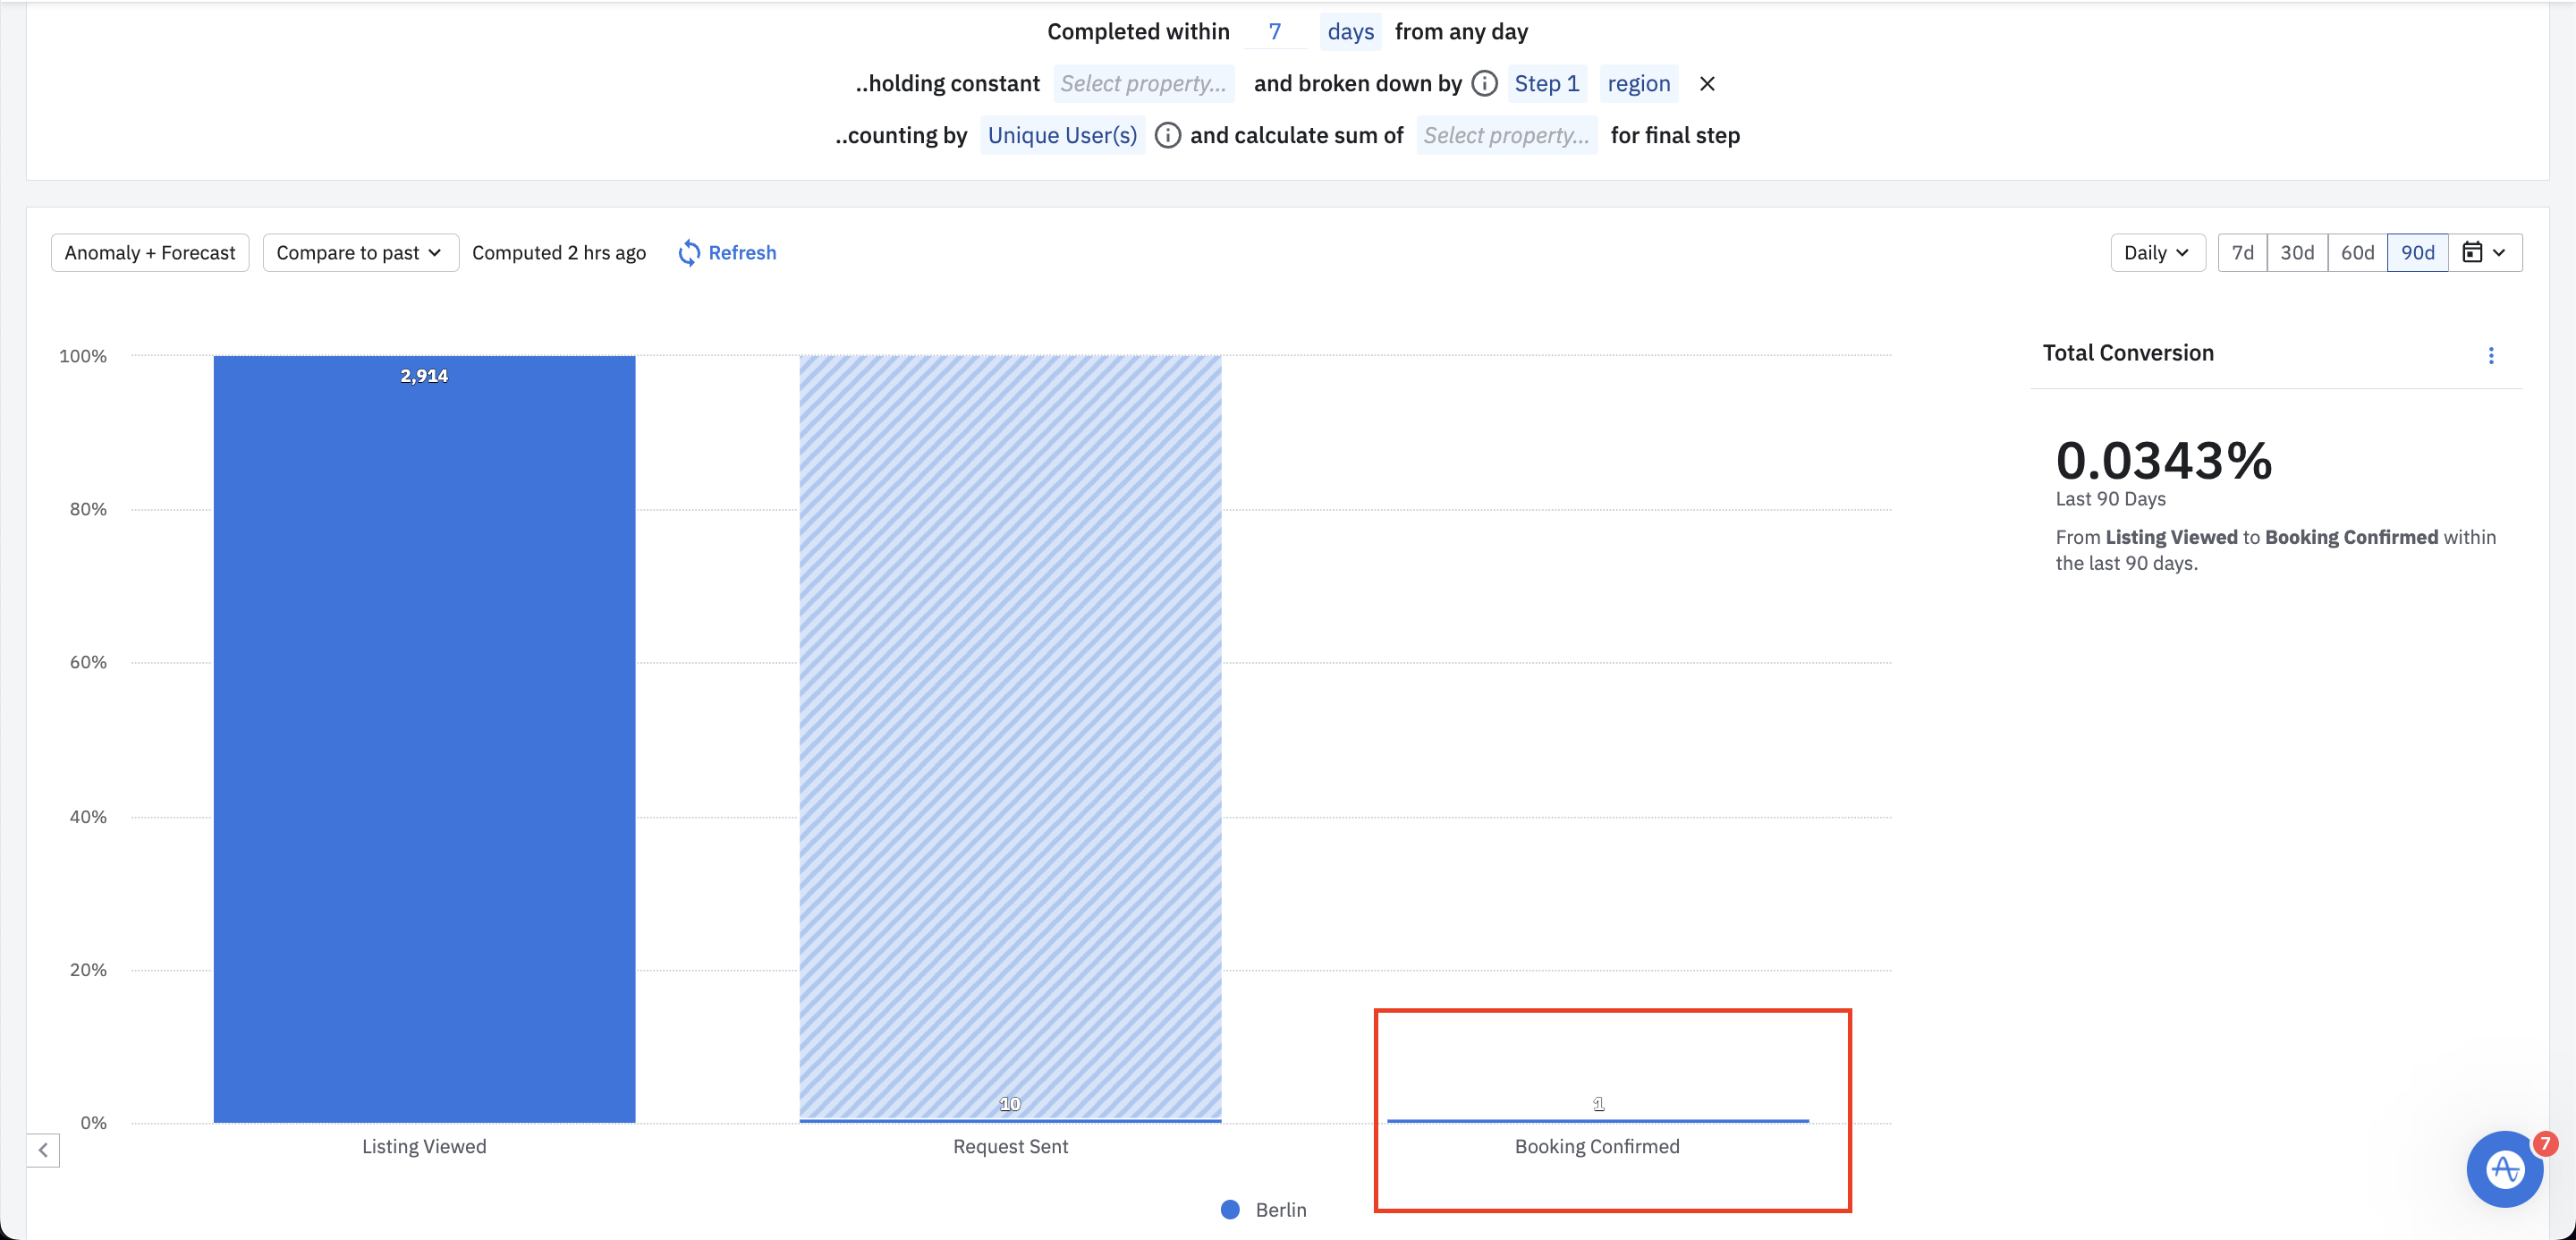
https://analytics.eu.amplitude.com/goboony/chart/e-gfp84to?source=copy+url


Completed within 30 days
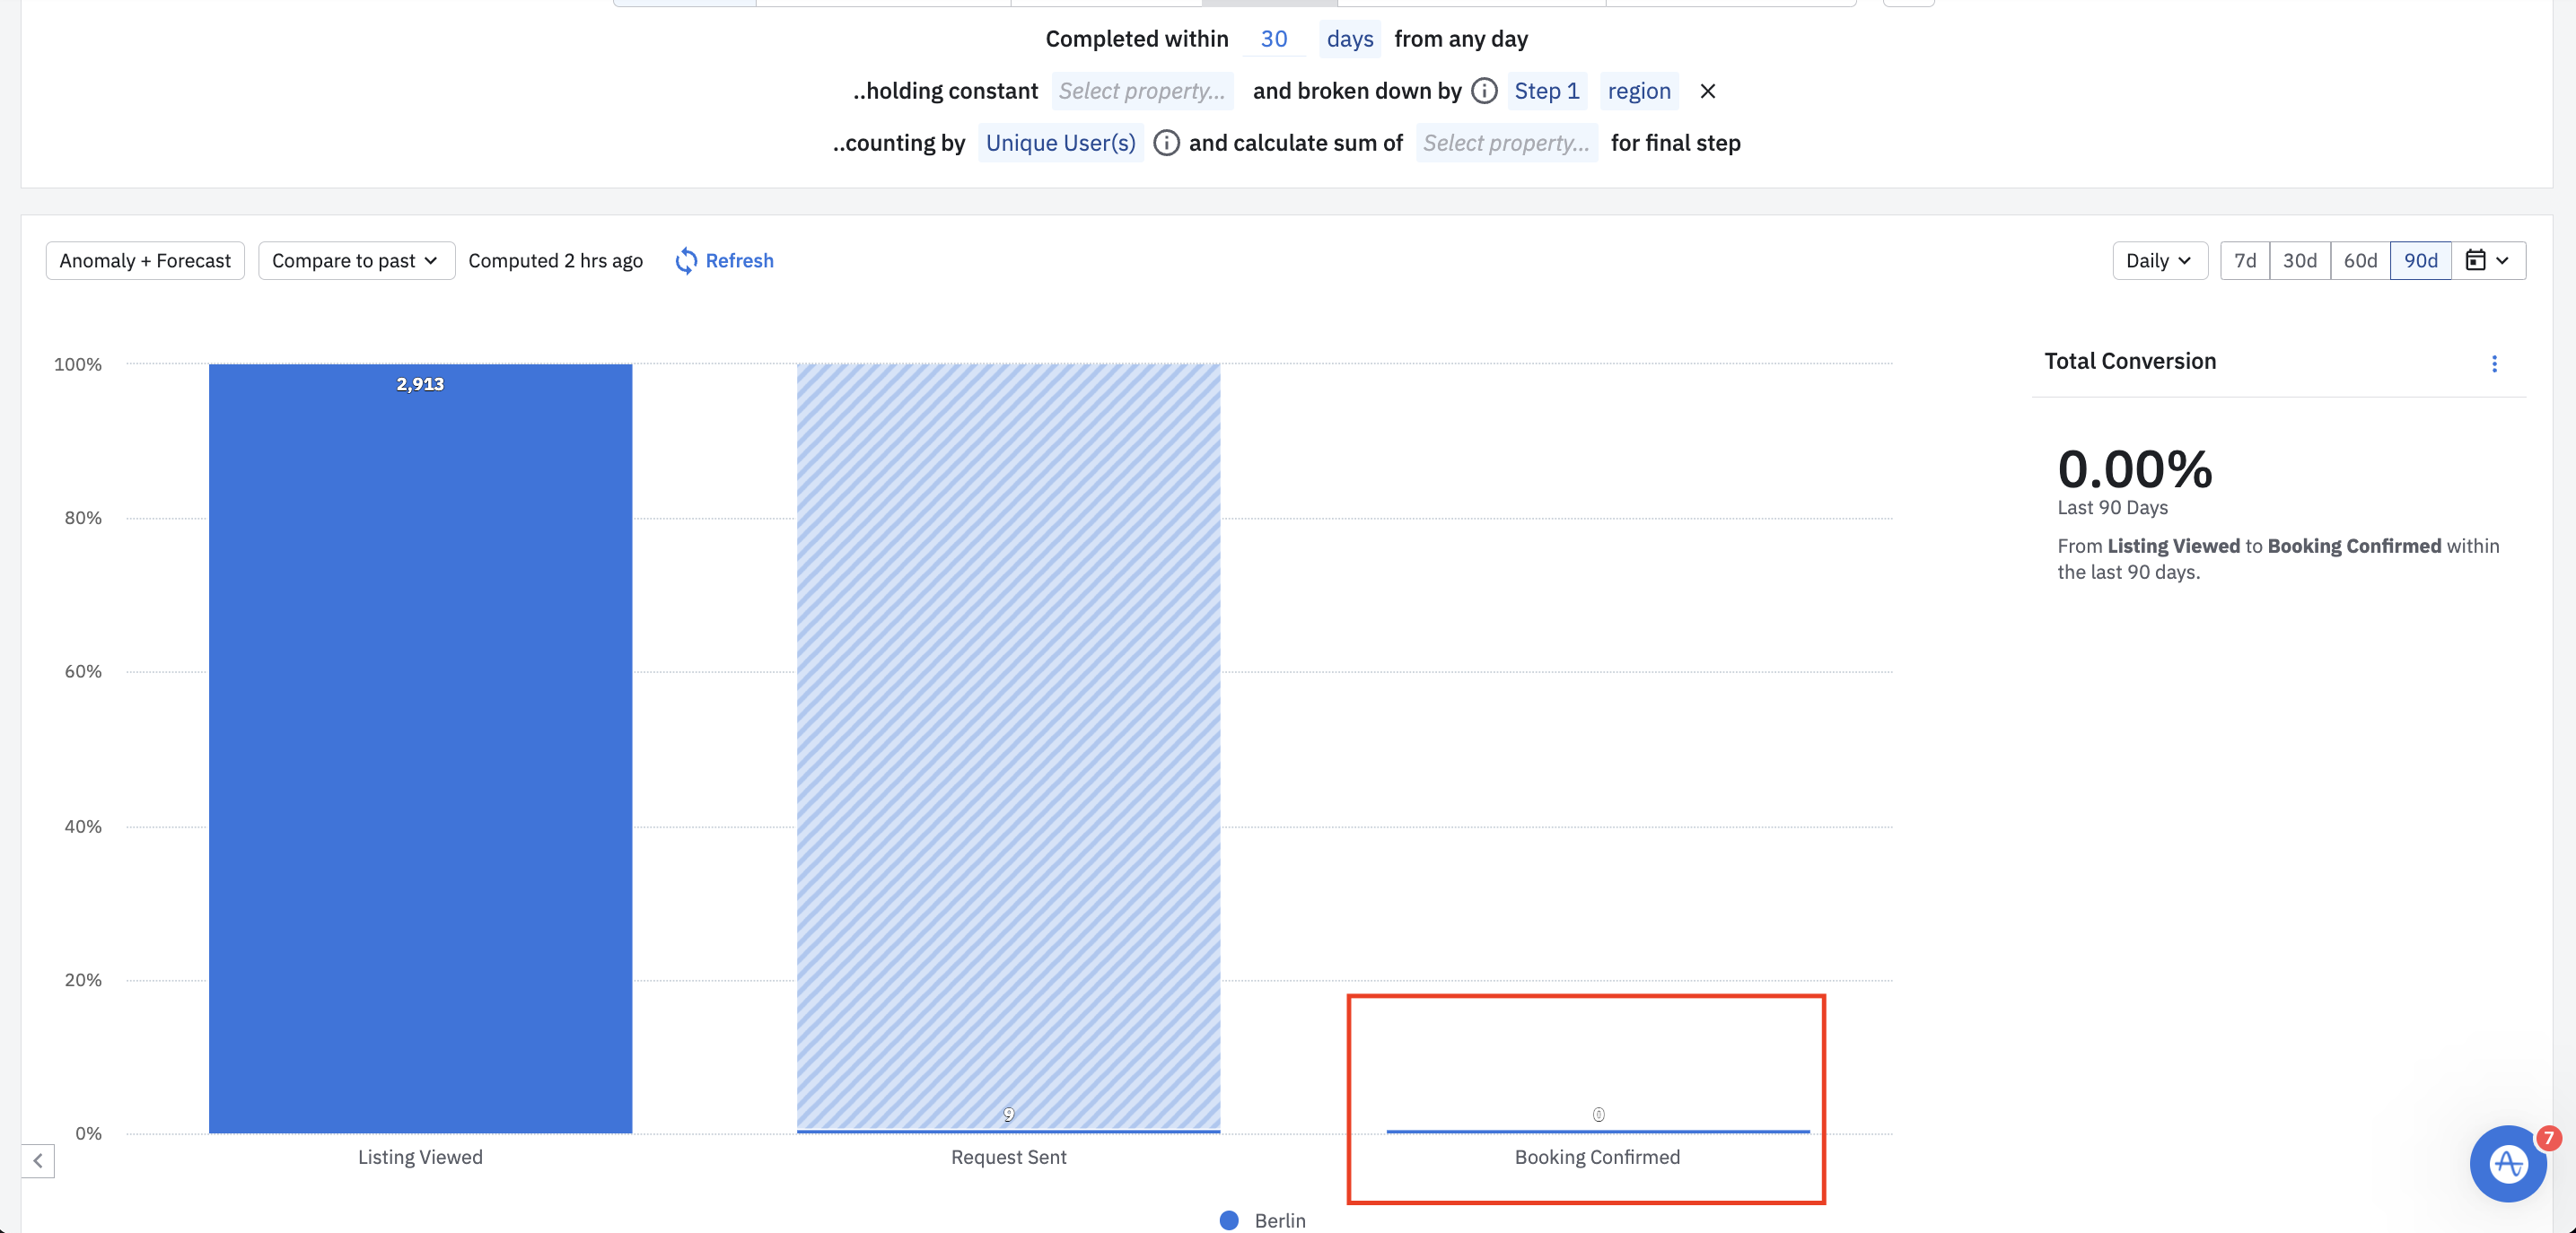
https://analytics.eu.amplitude.com/goboony/chart/e-0ch3gdj?source=copy+url

Hey @Rigo Goboony 

It appears that the top of the funnel in both those charts is different by 1 ( 2914 vs 2913) . So that one user which eventually converted to a confirmed booking didn’t get included in the 2nd funnel chart, causing the % to be 0.00. I could be wrong in reading this though.

I suspect this might be caused due to some timezone issues or chart refresh delays. You might want to pick that one user and see when their first event occurred within your 90 day frame.


Hi Saish,

Thanks for your quick answer. We’ve send the issue to support as well. It looks like a bug from your side. Your team is looking into it now. Thanks again!


@Rigo Goboony thanks for filing the support ticket! Posting the answer here to help members in the future:

So the microscope issue is a “known” limitation - when there is a funnel group by, we only persist the temporary users for the “highest volume” groups. 

For low volume groups, there is a chance of some users not being persisted, unfortunately. 

As a workaround, you can create a cohort from the data point to explicitly persist the users. 

Regarding the conversion window: Interpret your funnel analysis

see the section: NOTE: If users in your funnel can complete the steps multiple times, this method will take the first occurrence of each event and bucket the user for the value on that event.


Reply