Solved

Funnel Chart and Event count Show different numbers for converted users

  • 9 December 2021
  • 1 reply
  • 209 views

Badge
  • Conversationalist
  • 5 replies

Dear Amplitude Community, 

I would like to know how many of our new users (Step 1: verified account) convert into users who activated a trial / subscription (Step 2: subscription activated). Hence, I created a Funnel chart with those two steps and applied 20 days as a conversion window. 

The total number of converted users since November 17th that the chart shows me is 33.

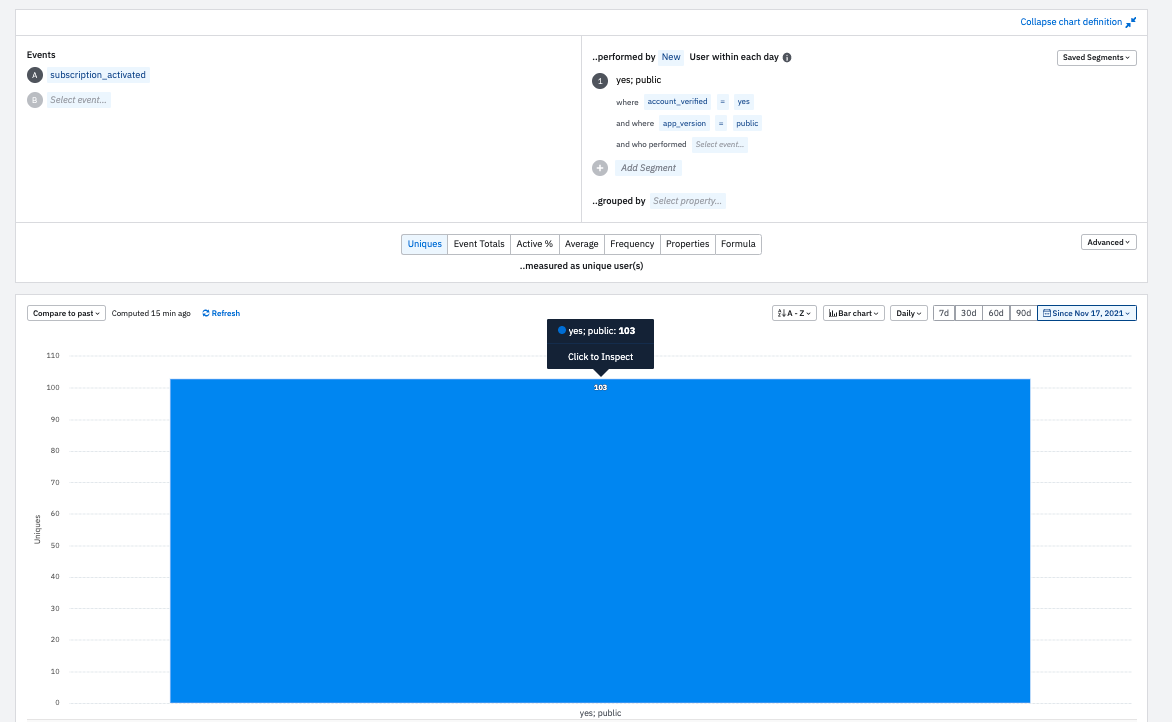
But, when performing a similar analysis in an event segmentation chart (event: subscription activated) performed by New Users WHERE account verified = yes and looking at total unique users  since November 17, it is 103 users. How can that be? Do I misinterpret the New User Property? 

Thanks a lot in advance! 

Please see screenshots below: 

1) Funnel Chart

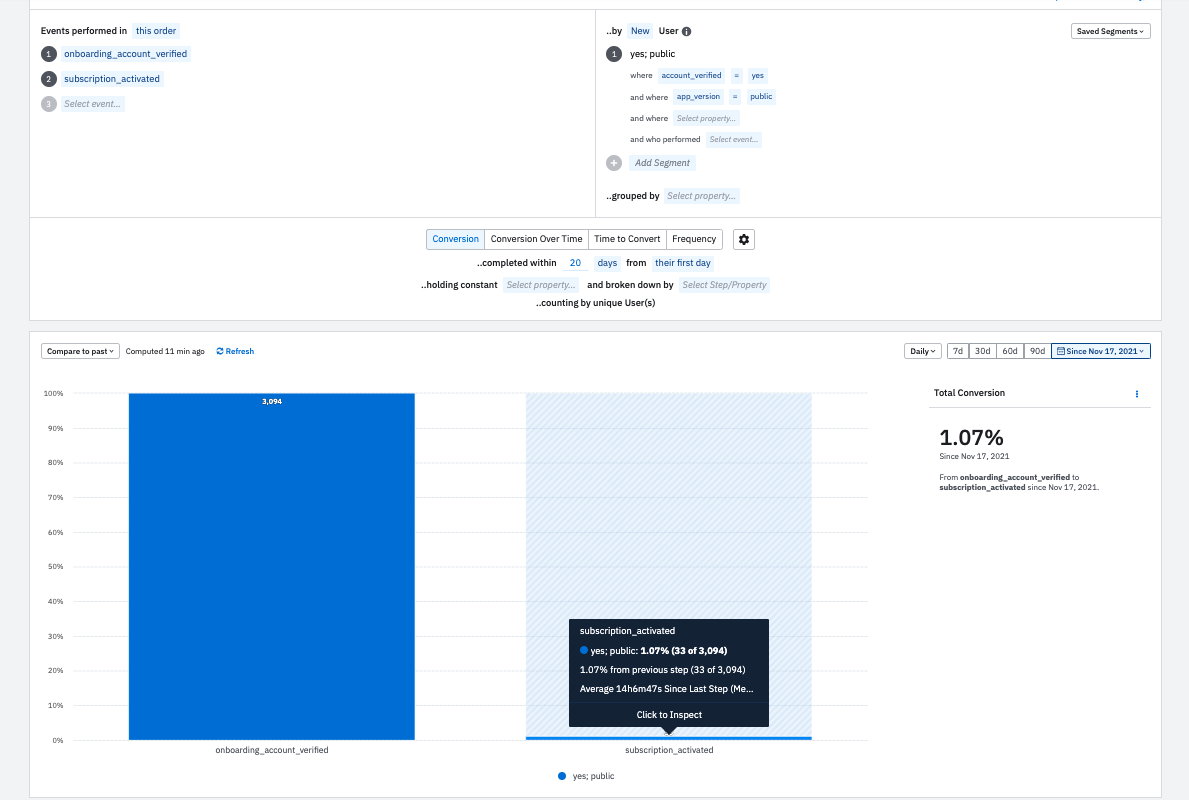
Funnel Analysis: Verified Account (=new user) to Subscription 
  1. Event Segmentation Chart: 


icon

Best answer by Yuanyuan Zhang 14 December 2021, 13:42

View original

1 reply

Userlevel 5
Badge +5

Hi @Asja

This is Yuanyuan from the Amplitude Support team - thank you for posting the question!

Looking from the two screenshots you provided, the parameters in two charts are different and the user properties are applied differently, so they are not comparable. In a Funnel chart, the user segment on the right module only applies to the first step event. So in your Funnel chart, you have the user properties applied to the event onboarding account verified, then you see 33 users who performed subscription activated after the event onboarding account verified WHERE account verified = yes and WHERE app version is public. In the event segmentation chart, you have the user properties applied to subscription activated and they do not have to perform onboarding account verified before that.

Based on your description and screenshots, without the detailed charts, this is how I interpret your event segmentation chart: it shows how many new users have converted into users who activated a trial / subscription with the condition account verified = yes since Nov 17. It seems to me the event segmentation chart is quite close to what you were looking for. 

Please let me know if you have something different in mind. 

Best, 

Reply