I have an Event Segmentation chart with two events, with greatly different amplitudes. I'd like to express them as a percentage change from a (start of period) baseline. This is common in finance. For example, here is a YTD comparison of two indexes (S&P 500 and a Cryptocurrency index). Note how each line is shown as a percentage change from the first time period inthe graph:
I have an Event Segmentation chart with two events, with greatly different amplitudes. I'd like to express them as a percentage change from a (start of period) baseline. This is common in finance. For example, here is a YTD comparison of two indexes (S&P 500 and a Cryptocurrency index). Note how each line is shown as a percentage change from the first time period inthe graph:
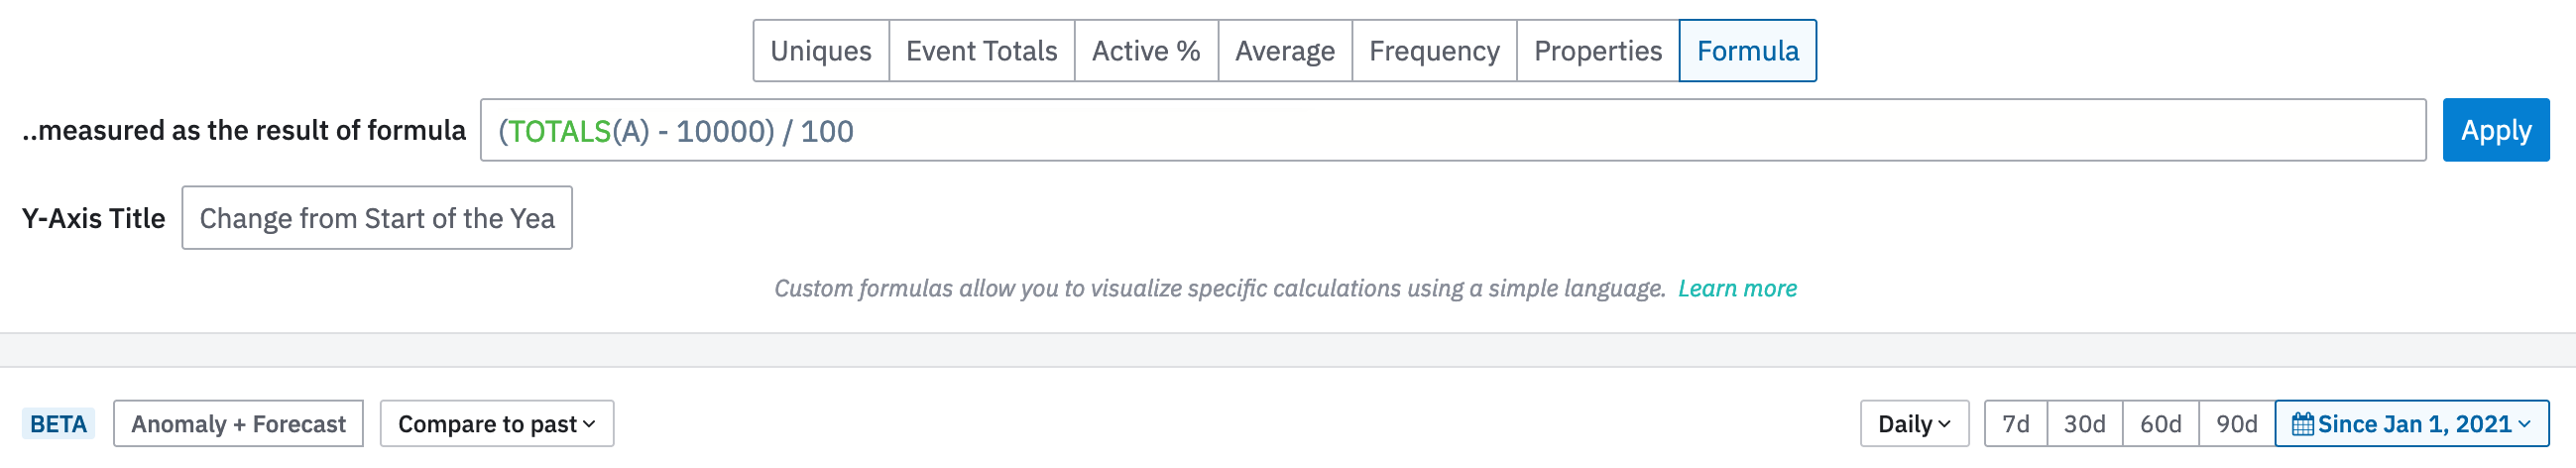
If you have a fixed comparison value (like a fixed starting point, such as start of the year), you can use custom formulas in the Event Segmentation (to achieve this. How exactly you would do that depends on what kind of data you want to visualize.
For example, if you are interested in event counts and your reference point is 10 000 daily events, you’d choose the event you are interested in and set the formula as (TOTALS(A) - 10000) / 100 (100 comes from 10 000 (your reference) divided by 100 (to make it percentage).
Or if you are comparing a numeric event property value like average, you’d choose the event, group it by the event property you are interested in and then set the formula as (PROPAVG(A) - 10000) / 100.
When adding multiple formulas, you separate them by ;, i.e. (TOTALS(A) - 10000) / 100; (TOTALS(B) - 10000) / 100.
Also note that when you define your custom formula, you can also label your y axis as you like.
If you have a moving starting point (like Last 90 Days), then things get trickier. If you are confident the value you are looking for will only increase, then you could set the reference value like MIN(TOTALS(A)) and offset your time selection by 1 day, so that your current, unfinished day does not mess up the results. However, this won’t work if the tracked value dips below the starting value at any point during the chosen time period, as the formula pick up the minimum value, regardless of when it happened.
Thanks @MikkoKarvonen! That’s where I ended up, too. There are manual ways to “hack” it but nothing automatic. I have a hard time believing I’m really the first person to want this (it’s such a common graph-type elsewhere!) but apparently so. The always-excellent Amplitude support also created this as a feature request.
If you don't have an Amplitude account, you can create an Amplitude Starter account for free and enjoy direct access to the Community via SSO. Create an Amplitude account. You can also create a Guest account below!
If you're a current customer, select the domain you use to sign in with Amplitude.
If you don't have an Amplitude account, you can create an Amplitude Starter account for free and enjoy direct access to the Community via SSO. Create an Amplitude account. Want to sign up as a guest? Create a Community account.
If you're a current customer, select the domain you use to sign in with Amplitude.