For our customers we provide daily recommendations that can either be followed or not. We provide these recommendations for several pieces of equipment at a customer site.
So I have 2 events:
- Recommendation X Created - Generated when our algorithms create a recommendation for a specific piece of equipment
- Recommendation X Followed - Emitted when we detect that the recommendation was followed for that specific piece of equipment
For example, for a given day there could be 20 Recommendation X Created events and 7 Recommendation X Followed events emitted. For simplicity assume the recommendation is a simple “Turn piece of equipment on at 8am”. In this example we will generate a different recommendation for each piece of equipment. So there are 20 Recommendation X Created events (each with different times.. like 8:05, 9:20, etc etc -- but ALL i care about is binary adherence… did you follow the recommendation or not for each piece of equipment)
The question I want to answer: “In aggregate, over the past 90 days, what is the weekly rolling average of adherence to Recommendation X across all pieces of equipment as a percent?”.
An example answer to this question I want: "On the graph I see that adherence to Recommendation X as a rolling 7 day average started at about 30% at the customer site and increased to 60% by the end of the quarter".
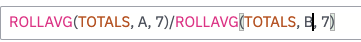
I can easily generate a graph showing Event Totals that shows a rolling average. By using custom formulas, for example Totals(A) / Totals (B), i can see the ratio/percentage however I can’t calculate this as a rolling average. I don’t want to see the totals, just the percentage adherence.
I know this isn’t a typical use case, however, I’m trying to use our existing tooling to allow non-technical members of my team to be able to generate this type of graph.. so seeing if i can figure out how to get Amplitude to do this.
Thanks for the help!