I really need help because I'm starting to pull my hair out on this supposedly "simple" subject.
I would like to be able to analyze the retention at D1, D3, D7 and D30.
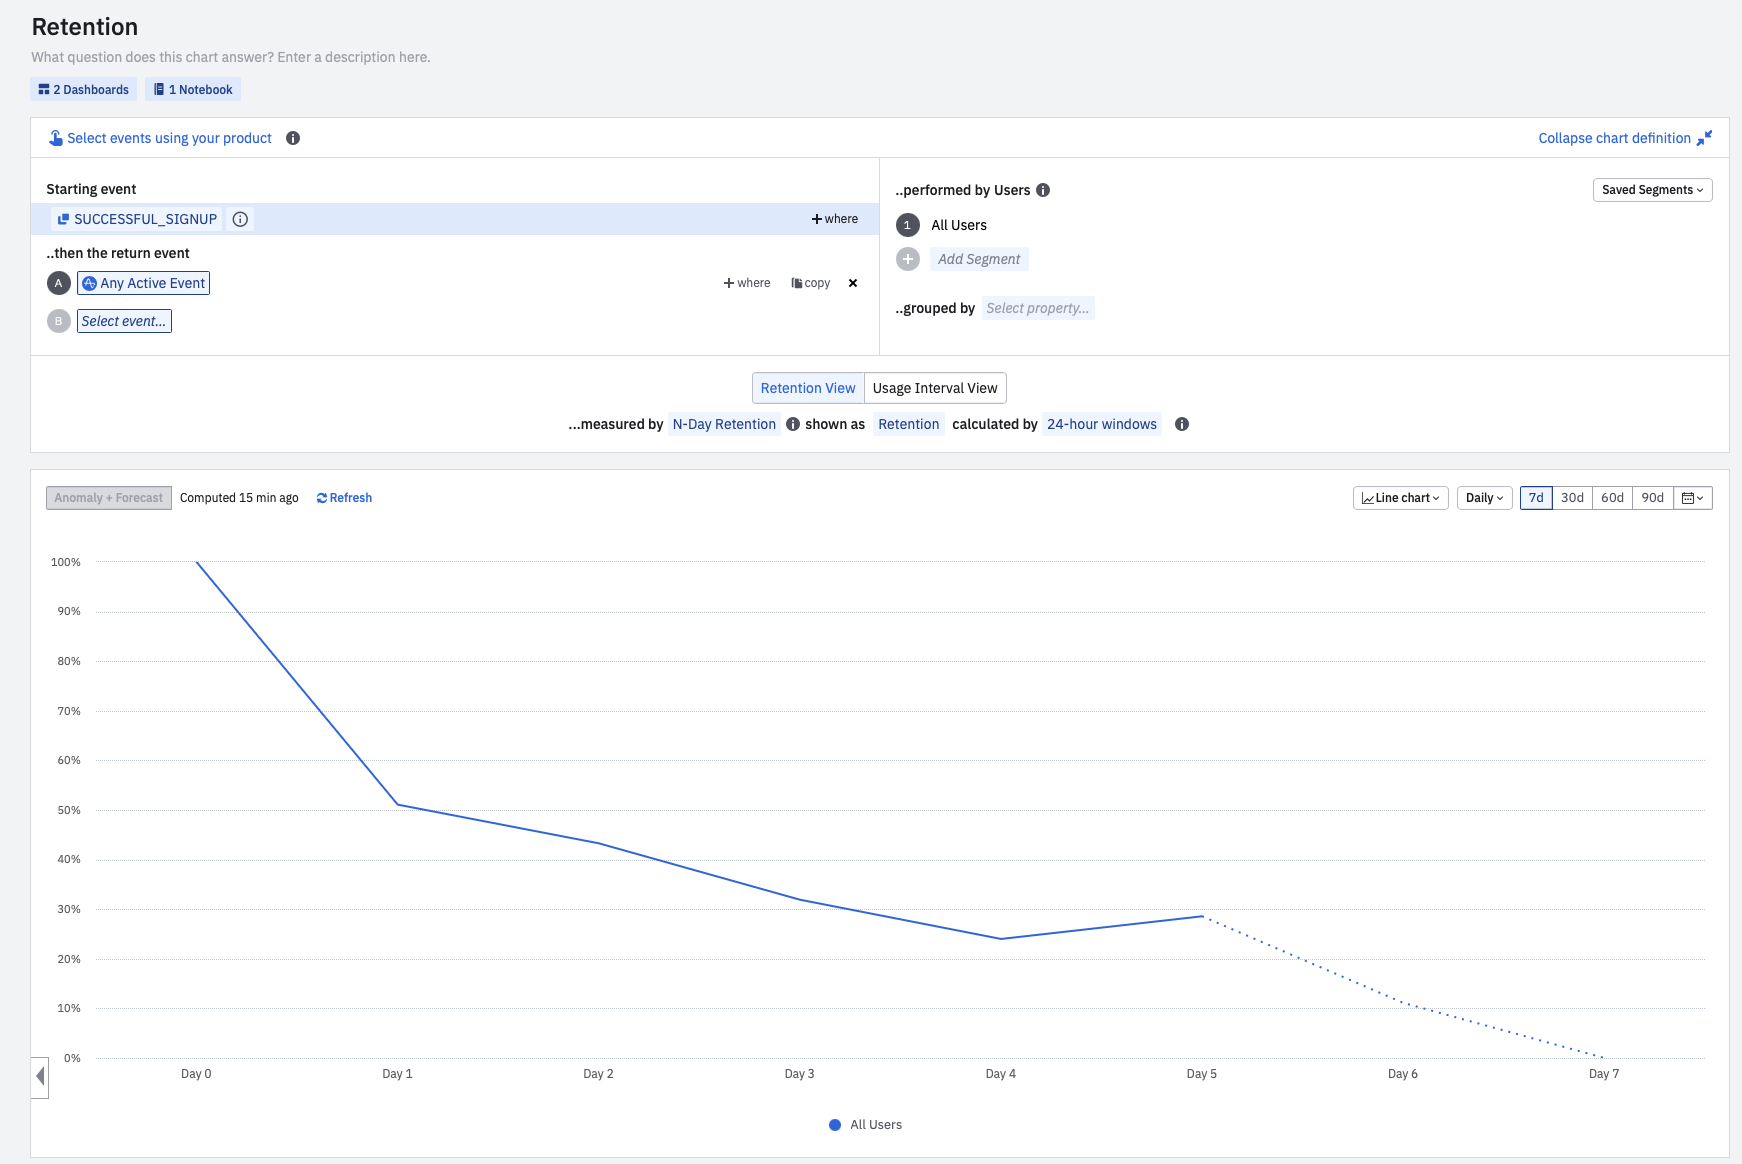
For now, I just want to know which users are coming back after creating an account.
To do this, I have set up a custom event called "Successful sign up" which, as the name suggests, is triggered when the user creates an account.
(I can't leave the default "New user" event because my application is made so that you have to create an account to be considered as a user. It is possible to open the app and see the content without having an account. Therefore, if I leave it as is, I end up with a very low retention)
For the return event, I left the amplitude one, namely "Any active event".
In fact:
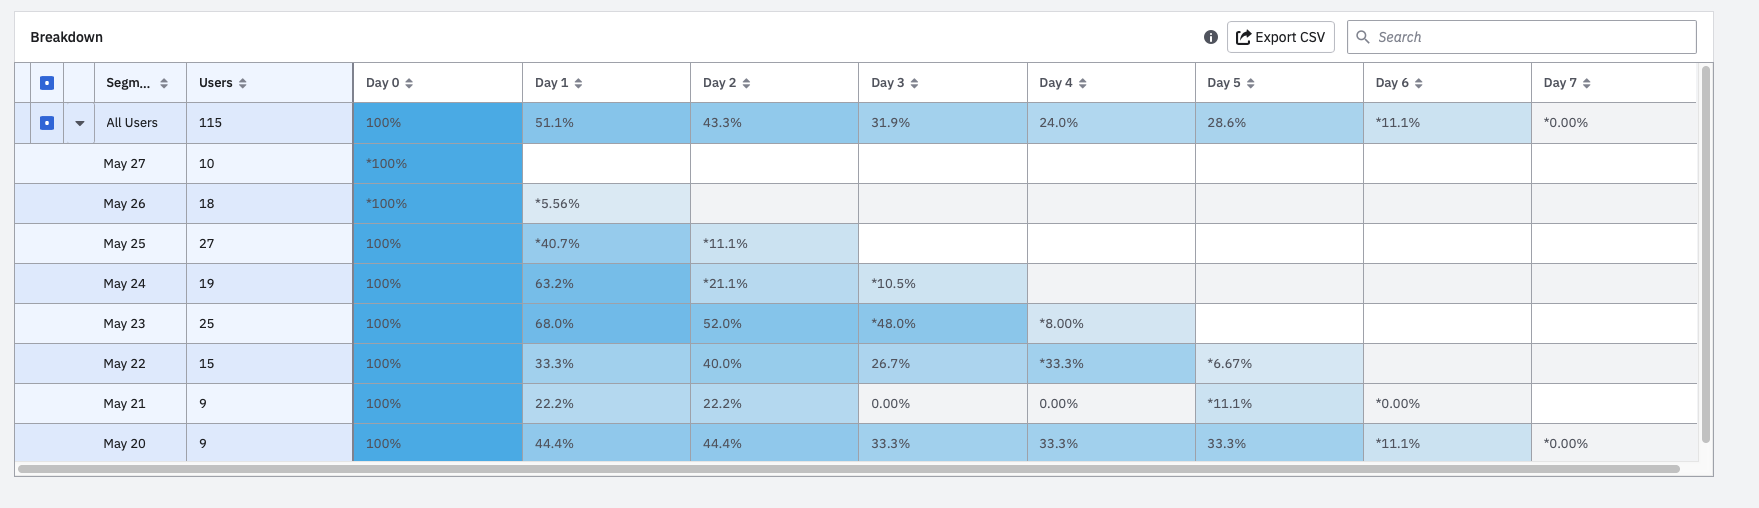
- in D0 I have 100% with 115 users.
- in D1 I have 51% with 47 users.
- in D2 I have 43,3% with 29 users
- in D3 I have 31,9% with 15 users
- in D4 I have 24% with 6 users...
- in D5 I have 28,6% with 4 users ....
As you can see, all the numbers are wrong. I should have something like this instead:
- in D0 I have 100% with 115 users.
- in D1 I should have 40,9%.
- in D2 I should have 25%.
- in D3 I should have 13%
- in D4 I should have 5,2%
- in D5 I should have 3,5%
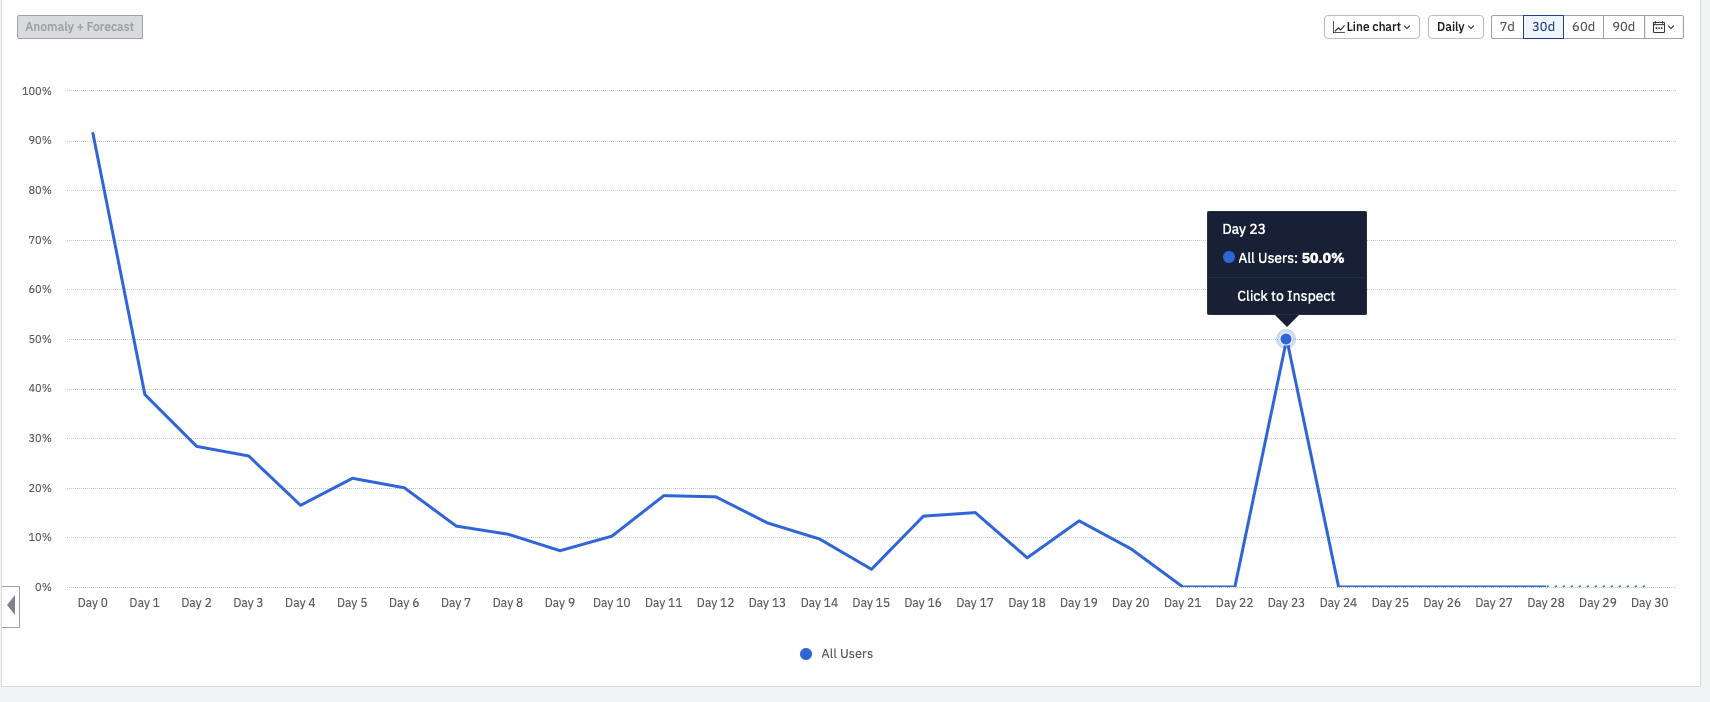
To show you more the absurdity of these results, you can see on the screenshots below that my application gets a retention of 50% in D23 while there is only one user…