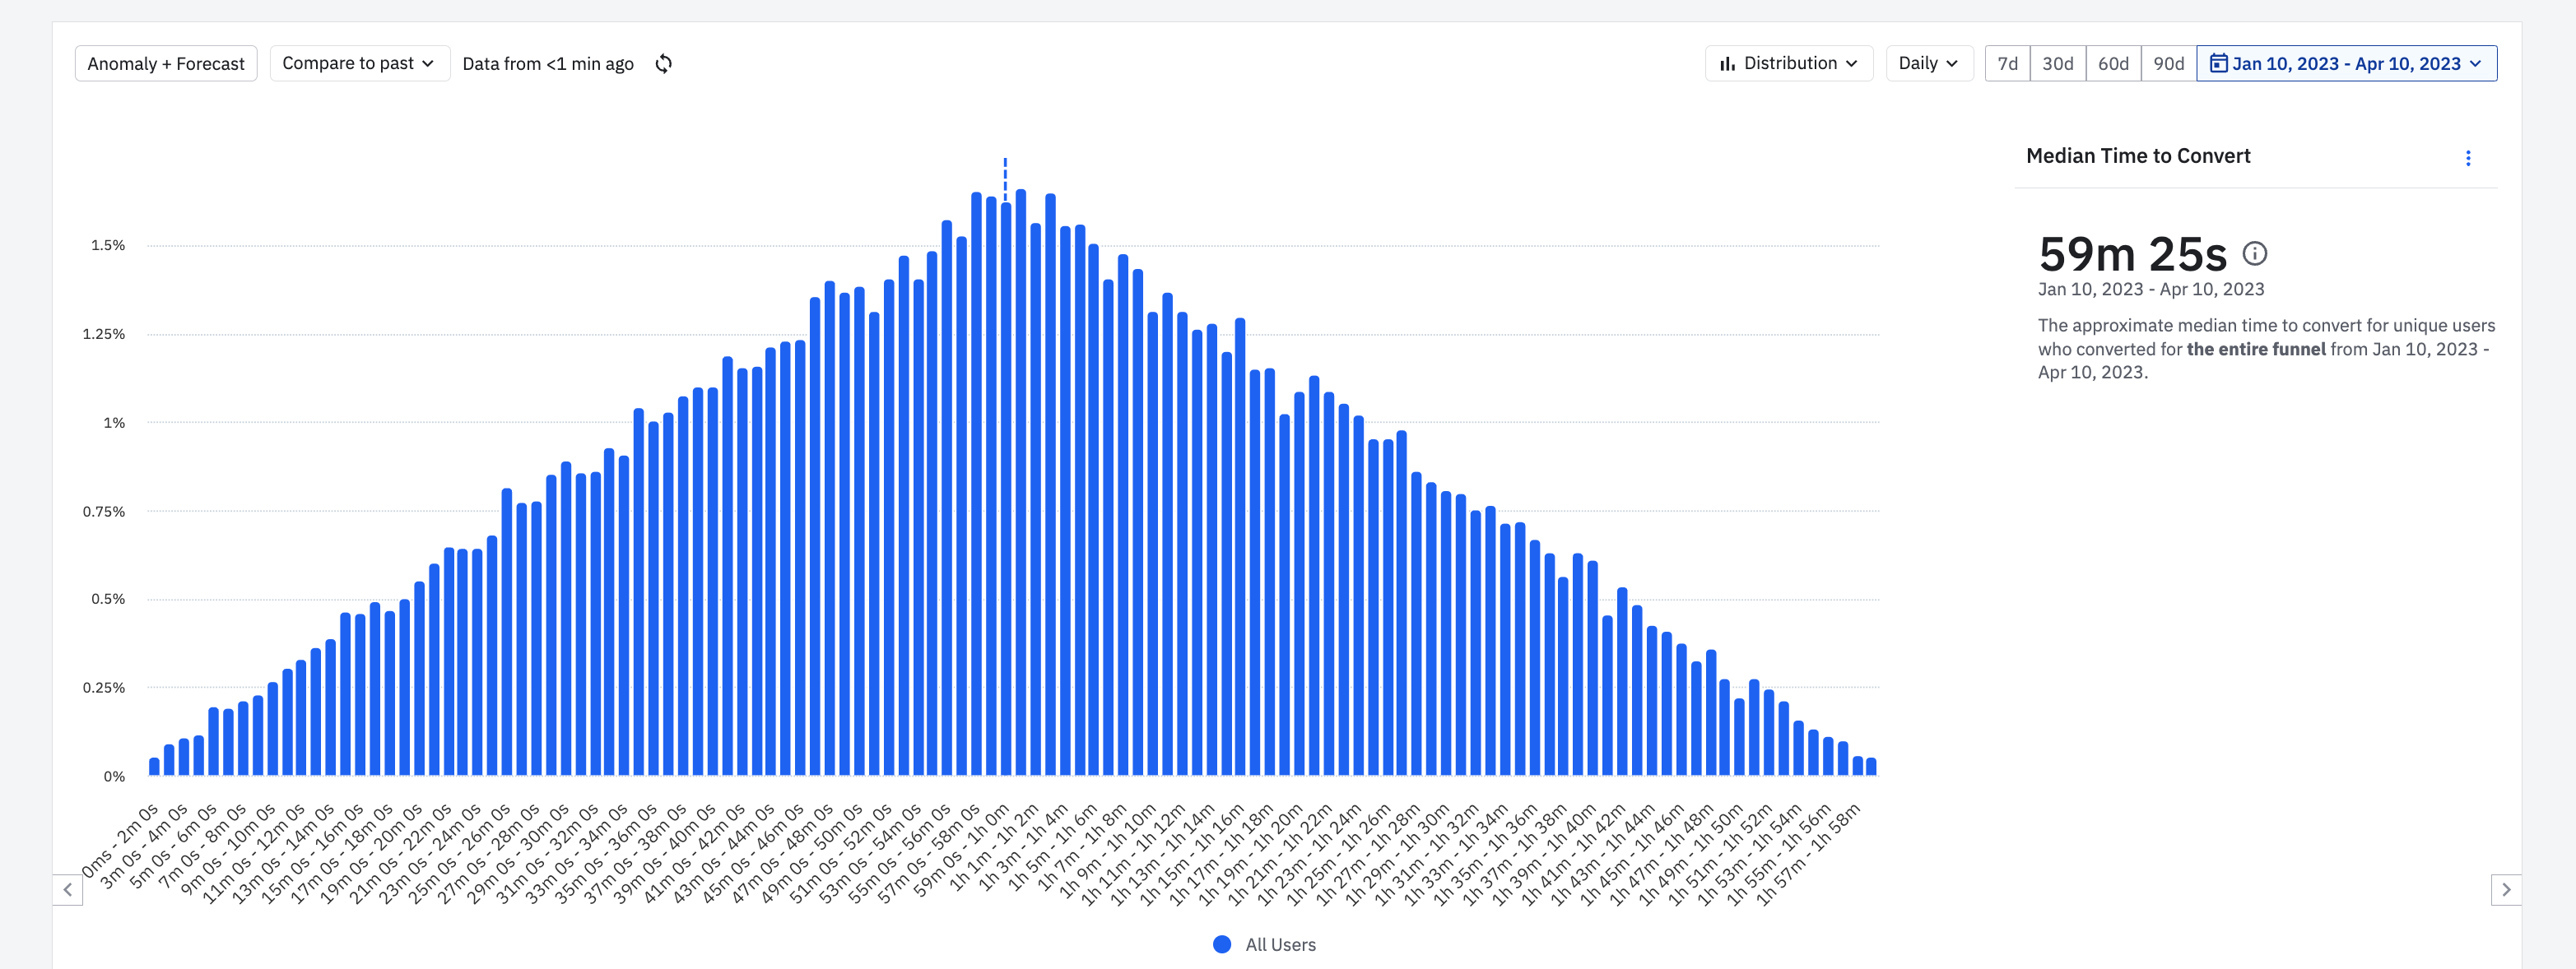
This is in B2B Chat Analytics, I tried but don’t know if my answer is correct. Hope someone can help me with this. https://app.amplitude.com/analytics/demo/chart/hjqmr0zx/edit/cbmsp21w
Hi
Since this is demo data, some of the funnels might not actually show up in the data for your set of clauses and date range. Hence you are seeing a 0% rate in there.
Here’s an alternate chart - https://app.amplitude.com/analytics/demo/chart/hjqmr0zx/edit/cm22r3mv
From this chart, you can pick up the following stats

From the “Time to Convert” (distribution) view https://app.amplitude.com/analytics/demo/chart/hjqmr0zx/edit/vl3jcqcb-,

I would suggesting perusing through this doc for getting insights from your funnel charts - https://help.amplitude.com/hc/en-us/articles/360053338671-Interpret-your-funnel-analysis
Hope this helps.
Reply
Welcome to the Amplitude Community!
If you don't have an Amplitude account, you can create an Amplitude Starter account for free and enjoy direct access to the Community via SSO. Create an Amplitude account. You can also create a Guest account below!
If you're a current customer, select the domain you use to sign in with Amplitude.
analytics.amplitude.com analytics.eu.amplitude.comWelcome to the Amplitude Community!
If you don't have an Amplitude account, you can create an Amplitude Starter account for free and enjoy direct access to the Community via SSO. Create an Amplitude account. Want to sign up as a guest? Create a Community account.
If you're a current customer, select the domain you use to sign in with Amplitude.
analytics.amplitude.com analytics.eu.amplitude.comEnter your E-mail address. We'll send you an e-mail with instructions to reset your password.


