Hi, I would like to know “Personas Chart” > top events and lower events
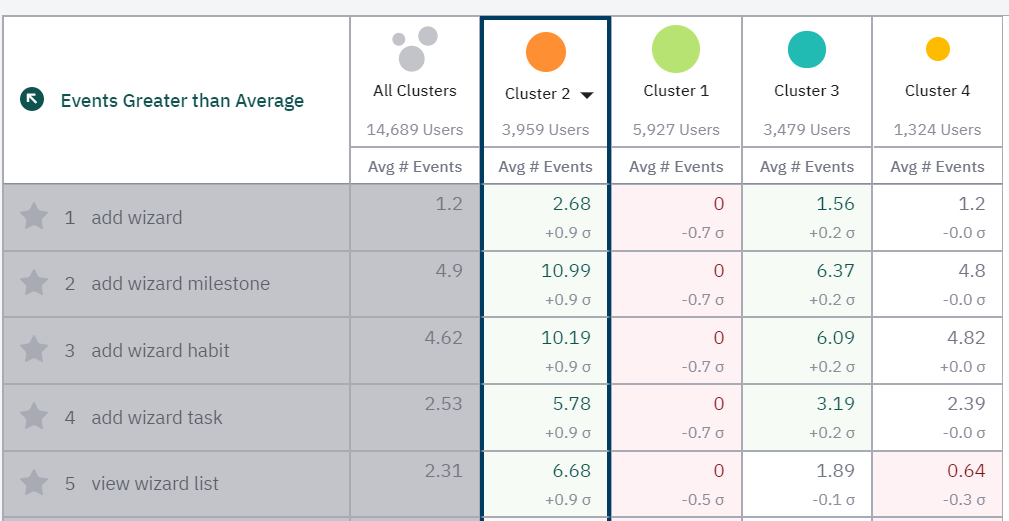
the average # of events: for example, cluster 2 users do event “add wizard” with the average number of 2.68, then it means that 3959users *2.68 =10,610 “Add wizard” event has been fired in total
what does σ mean? the standard deviation?? σ how is it calculated? It looks like the events are listed in the order of the bigger the σ is, the upper in the list the event is located. however, if this is standard deviation, if it’s bigger, it means that the difference from the mean is big, and that means there are some users who aren’t performing like the mean number of events. If so, I think the lesser the σis the more important that event is, because almost all the users are firing the event Also, if this is standard deviation, there’s no minus value for standard deviation, but for the event “Add wizard”, cluster 1 is showing minus value. I really don’t understand.
Page 1 / 1
Hi, I would like to know “Personas Chart” > top events and lower events
the average # of events: for example, cluster 2 users do event “add wizard” with the average number of 2.68, then it means that 3959users *2.68 =10,610 “Add wizard” event has been fired in total
what does σ mean? the standard deviation?? σ how is it calculated? It looks like the events are listed in the order of the bigger the σ is, the upper in the list the event is located. however, if this is standard deviation, if it’s bigger, it means that the difference from the mean is big, and that means there are some users who aren’t performing like the mean number of events. If so, I think the lesser the σis the more important that event is, because almost all the users are firing the event Also, if this is standard deviation, there’s no minus value for standard deviation, but for the event “Add wizard”, cluster 1 is showing minus value. I really don’t understand.
Yes, although rounding the average may mean that the total number of events is not exact match.
It’s standard deviation, but the comparison is not to the average of the chosen cluster, but the average of all clusters. You can see this average under All Clusters column, i.e. for “add wizard” event it’s 1.2. Essentially this tells you how defining the triggering of this event is for this cluster, compared to your whole user base. You are correct that the negative standard deviation values are not strictly speaking correct, but they are used here to indicate that for this cluster, the average number of events is below the average of all the clusters. The deviations in your example are not very large, so none of the events are very defining. However, in Personas it’s often important to look at the overall profile, not individual event. I.e. which events this cluster in general does more often, which less often than is typical.
In general, when running Personas analysis, I would recommend three things:
Use project settings to exclude events you don’t want to be included in the Personas analysis. You can do this by going to Govern, then Events and then using the Visibility column to de-select events from the Personas analysis. This allows you to remove things that are not relevant for your user behaviour analysis. A typical example would be SignUp event, which easily creates a cluster that essentially collects your new users into one cluster that does not offer much in the way of actual insights.
Running the analysis with different cluster sizes to see how that affects the results. Often you’ll find a sweet spot where increasing the number of clusters does not produce any meaningful differences (it gets very nitpicky or the differences start to be focused are less important events), but decreasing it would lose interesting user groups.
Once you find a good amount of clusters, save them as cohorts and continue your analysis using other Amplitude tools. Personas does not take into account event properties or user properties, so you’ll often find interesting further insights like this.
Thanks for your clear answer.
thus if the standard deviation from the average of all cluster is huge, then it means that that event was fired more distinctively in that selected cluster,
and that is the reason why all the events for the selected cluster are listed from the higher standard deviation to lower standard deviation.
That made all the understanding much clearer.
Also thanks for your helpful tip about excluding some evnets from the persona chart! I have changed some from Govern thanks to your kind instructions.
thanks!
two more things to ask..
you told me the deviation isn’t that big… if so, what figure do you consider it to be meaningful?
once I found intersting cluster, to analyze this cluster more in depth, with event properties or user properties, after saving this cluster as cohort, should I go back to clasic event segemtation chart? are there any other suggestions?
There isn’t a universal answer to this, as it’s heavily dependent on the type of service you are analysing and the event in question. We have some highly specific features that are used by a small group of users but they use them heavily, so they might show up as standard deviation 4 or 5 in these charts. But if we are not interested in that kind of difference in the analysis we are running, that can be a distraction rather than an interesting result. On the flip side, if you have key features that certain groups of users are utilizing much more intensively than others, that can be a great indication of your super users. So I didn’t mean to indicate that the differences in your example data wouldn’t be meaningful, just noted that the range can be much larger than what you are seeing here.
I like to use the different tools in Amplitude quite widely when doing this follow-up analysis: event segmentation to look at the event properties in key events, user properties, retention and stickiness can be very interesting.
Based on my experiences, doing Personas analysis and follow-ups can be some of the most involved, deep diving, and lengthy analysis you do in Amplitude. But the outcomes can be great too: we have run a small number of really extensive number of Personas analysis, but they have given us great insights that we really wouldn’t have gotten otherwise.
Reply
Welcome to the Amplitude Community!
If you don't have an Amplitude account, you can create an Amplitude Starter account for free and enjoy direct access to the Community via SSO. Create an Amplitude account. You can also create a Guest account below!
If you're a current customer, select the domain you use to sign in with Amplitude.
If you don't have an Amplitude account, you can create an Amplitude Starter account for free and enjoy direct access to the Community via SSO. Create an Amplitude account. Want to sign up as a guest? Create a Community account.
If you're a current customer, select the domain you use to sign in with Amplitude.