I want to be able to download or explore an event in a funnel step further.
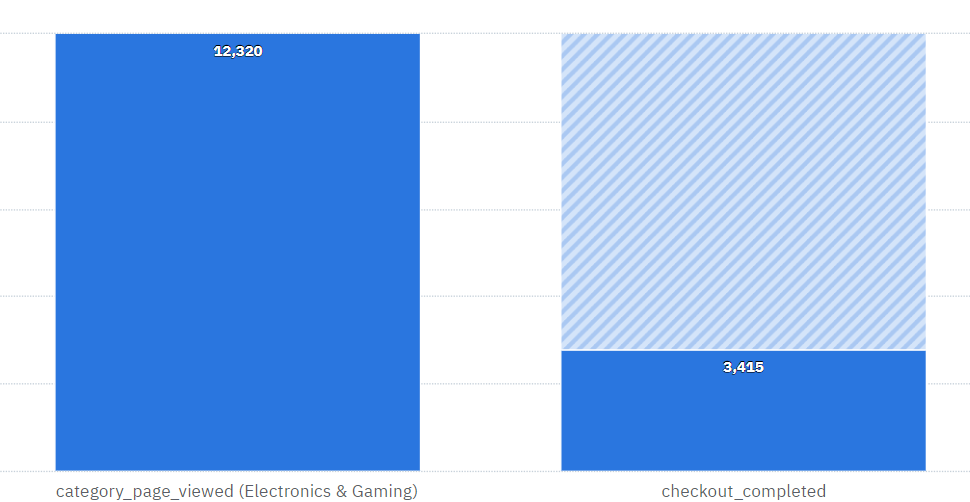
For example, in this funnel, I want to explore the properties of the 3415 checkout events in a segmentation chart to see for example the average order value or products bought.
Any idea how to do that?
Page 1 / 1
hi @andrew_edward ,
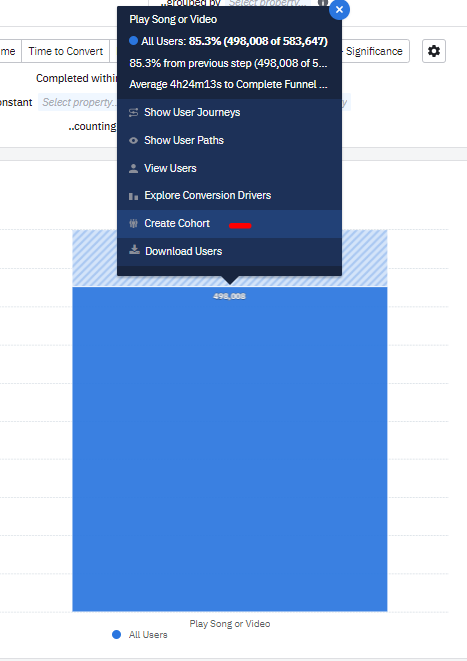
you can create a cohort of those 3415 users who triggered the “checkout_completed” event by left-click on them and selecting the “Create Cohort” option and name it as you prefer. Then create a new segmentation chart where you filter the Cohort you have just created and use the “group by” clause to get deeper level of details and learn more about your users,
let me know if it helps,
Hello Tatiana,
Thank you so much for your reply. The problem with the suggestion you sent is that its at a user-level not event-level. The users from the cohort exported could have performed the events multiple times, I want to isolate only these 3415 events not the users of the event.
For example a user could have checked out from merchant A and Merchant B.
Funnel shows:
Checkout from Merchant A (1 out of the 3415)
But when I extract the list of customers, it will show the two checkouts A & B.
Hi @andrew_edward ,
This is Nehita from Amplitude Support, thanks for writing in to the Community! Happy to answer your question, and thank you @Tatiana for your detailed response!
While it is currently possible to export user data from your Funnel chart and conduct the type of analysis that Tatiana explained at a user-level, unfortunately this is not currently possible at an event-level. However, I can understand how being able to do this would be useful and I would be happy to submit a feature request to our Product Development team for future consideration.
I hope this helps to clarify, but please let me know if you have any questions!
Best,
Nehita
Hey @andrew_edward
I’m not sure if this will solve your use case, but you can create a Totals event seg chart of just the checkout event/s ( either from a filtered clause on merchant A or group by merchant name ) on the generated cohort, in the same time frame as the funnel. I’m hoping this would isolate just the checkout events of the cohort of converted users within time frame which was used in the funnel. You can then use the desired formulas to calculate average order value for these isolated events.
One downside of this is that it might not guarantee that the checkout events were always performed right within your funnel conversion window after step1 if your conversion window is greater than the time frame of the chart.
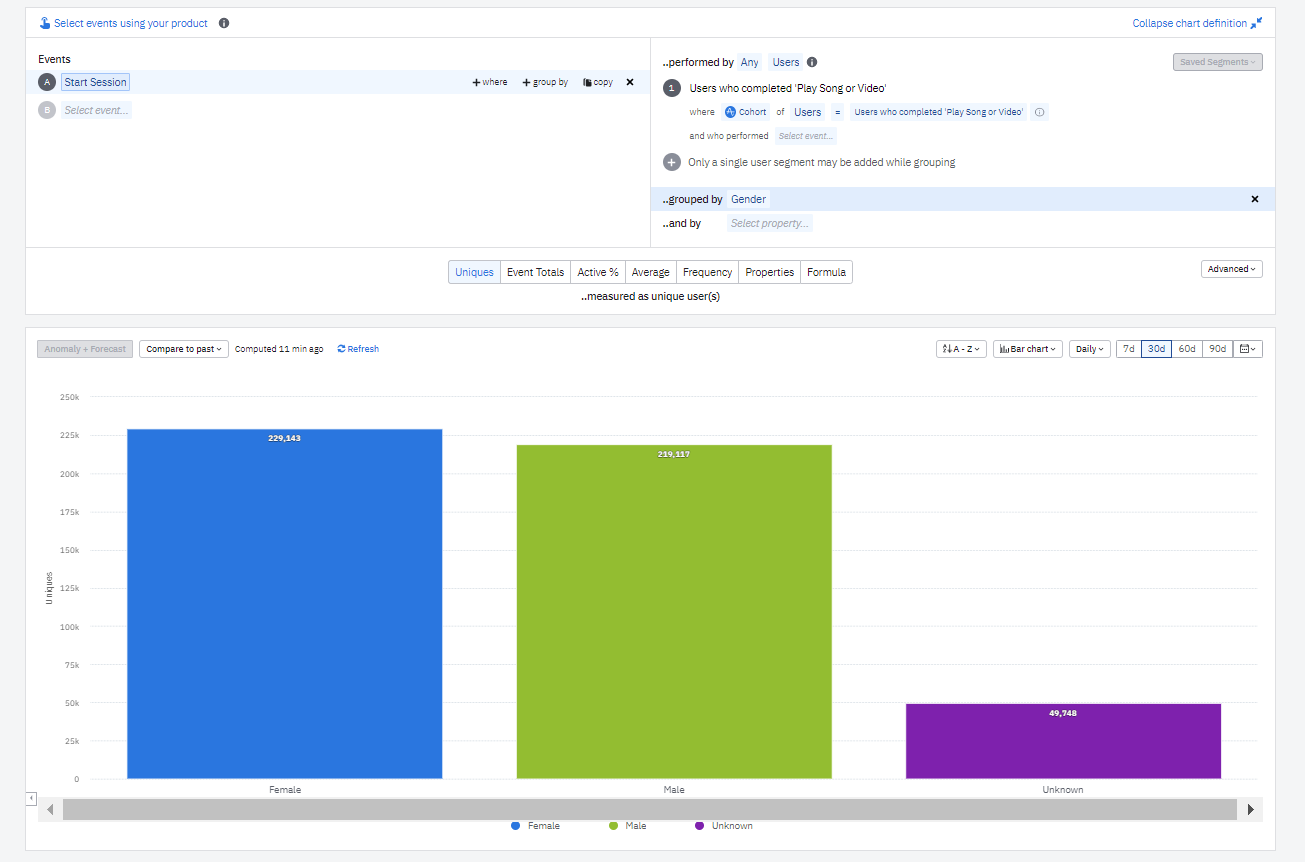
Here, I’m creating a cohort of converted users for this funnel chart and then using this on the event from step 2 in this chart. If you switch to totals view, you see this cohort performed 106 total events within last 30 days ( > than the 7 day conversion window ). You then use the properties metric to get sum/average of your desired value, like this one. You can see if this approach works out for you and if any edge cases pop up by examining some individual users.
Let me know if I missed out something obvious in my understanding.
Thanks for the suggestion @Saish Redkar , the only issue with your approach becomes when the case is that this event can be performed multiple times by the user in a small duration.
Thank you @Nehita I. for you response. It is really sad that such an option does not exist currently. :((
The option doesn’t have to be necessarily to download the events as much as being able to push the events to a segmentation chart to explore them more in details.
This will be extremely helpful to our team to explore the events more in detail outside of the funnel and be able to group by from the funnels in segmentation charts and much more.
For example, if I want to show the distribution of merchants from these checkouts in my example (How many are from Merchant A, how many are from Merchant B, etc.) in a segmentation chart, it will be amazing for business stakeholders.
Right now, the closest way to do it is grouping by the property at the last step of the funnel, but at that point, it is extremely not presentable.
I just assumed since the count of the events is there, Amplitude should for sure provide those events, I hope it won’t be too hard to implement something like it. Hope it fits with your product roadmap.
Hi @andrew_edward ,
Thanks a lot for your feedback, and apologies that this functionality doesn’t currently exist in Amplitude. We take customer feedback seriously and appreciate you taking the time in letting us know how we can improve the Amplitude experience for you. I have passed this along to our Product Development team to consider for future implementation, thanks again for bringing this to our attention!
Best,
Nehita
Hi @andrew_edward We appreciate your feedback. Here’s more information about our ideas forum, where you can vote on other ideas too. Thanks in advance for contributing!
Reply
Welcome to the Amplitude Community!
If you don't have an Amplitude account, you can create an Amplitude Starter account for free and enjoy direct access to the Community via SSO. Create an Amplitude account. You can also create a Guest account below!
If you're a current customer, select the domain you use to sign in with Amplitude.
If you don't have an Amplitude account, you can create an Amplitude Starter account for free and enjoy direct access to the Community via SSO. Create an Amplitude account. Want to sign up as a guest? Create a Community account.
If you're a current customer, select the domain you use to sign in with Amplitude.

 We appreciate your feedback. Here’s more information about our ideas forum, where you can vote on other ideas too. Thanks in advance for contributing!