Solved

Change the x-axis on line chart to an event property

  • 25 October 2021
  • 9 replies
  • 1109 views

Badge

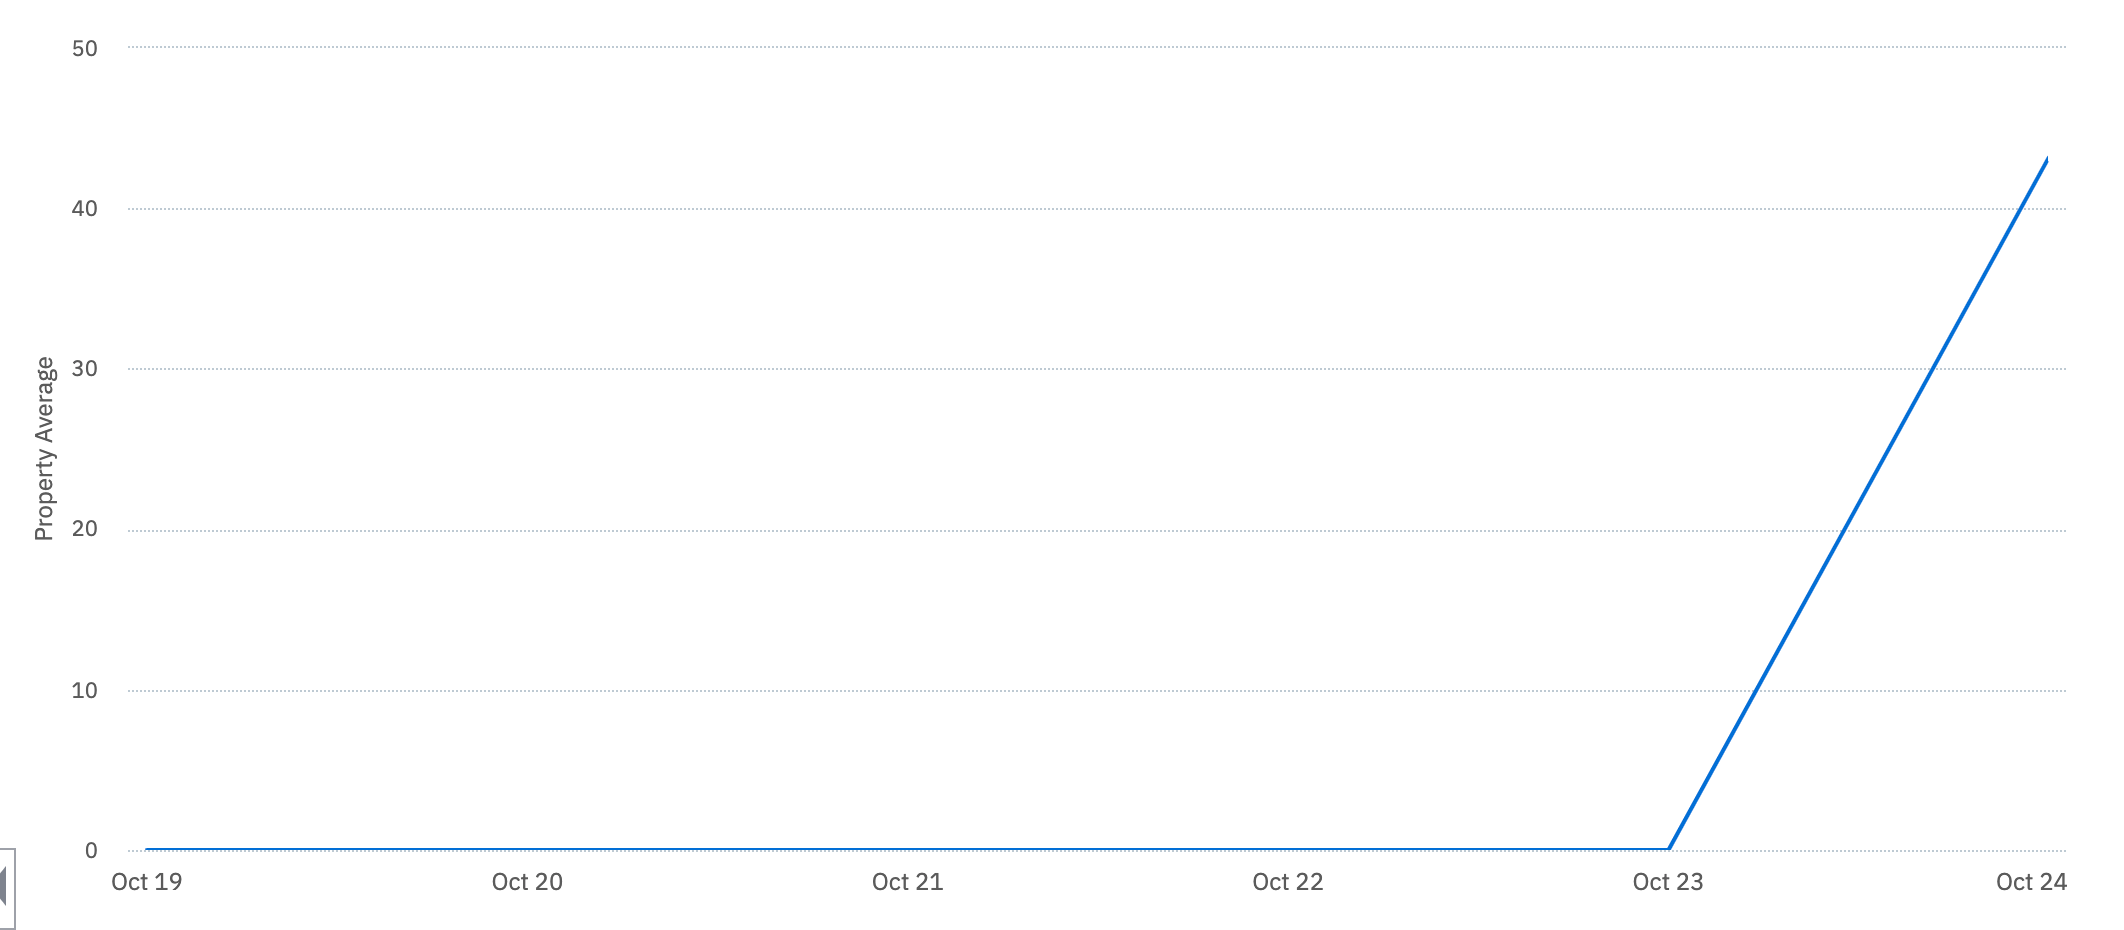
Is it possible to change the x-axis on a line chart to an event property?

Our use case is tracking an event property “value” that occurs on a “date” which is another event property. The metric corresponds to the “date” property, not to the time at which the event was created/received so we need the x-axis to be the “date” instead of the event timestamp. 

Our events look like this:

[
{ "date": "2021-10-19", "value": "50" },
{ "date": "2021-10-20", "value": "40" },
{ "date": "2021-10-21", "value": "30" },
{ "date": "2021-10-22", "value": "60" }
]

and we want to plot the `value` on the y-axis versus the `date` on the x-axis. These events may all be sent to Amplitude at the same time which means that the default line chart will put them all at the same timestamp.

Here’s a graph that shows what happens when we try to plot the data (which all arrived on 2021-10-24). 


icon

Best answer by MikkoKarvonen 26 October 2021, 06:56

View original

9 replies

Userlevel 5
Badge +3

If I understood this correctly, this kind of approach might meet your needs: https://analytics.amplitude.com/demo/chart/new/kan2x7k

To break this down into individual steps:

  1. Choose your event.
  2. Group by the value you want to have on your y axis.
  3. Add another Group by, this time by the value you want to have on your x axis.
  4. Switch to the Properties button above the chart. If you have one event per date, Sum, Average, and Median will all do the trick. If you have more than one, you’ll know best which one to use.

If you have more than one value per date and you want to see the distribution of these values, you might have more trouble, but could try Distribution of Property Value or switching to the horizontal bar graph visualization.

However, I’d also like to suggest an alternative, that migth be simpler: you can define your event_time when sending in events to Amplitude. How about defining the event_time for each event to match your date event property? That would make it easier to utilize the tools Amplitude offers you.

Badge

@MikkoKarvonen Thanks for the response!

We do have more than one value per date which means we can’t use your first solution. However, we are able to set the `event_time` on the events sent to Amplitude which allows us to correctly graph them on the x-axis. 

The simpler approach unsurprisingly works best :relaxed:.

Userlevel 5
Badge +3

Getting your data into right shape instead of engaging in Amplitude acrobatics with non-optimal data is the right answer to surprisingly many questions! Happy to hear this helped.

Badge

Hi guys! @MikkoKarvonen @willkoehrsen 


Could you explain if there is any difference if I instead apply `event_time` as user property which I will update for example each second? Yes, the disadvantages are that

  • it can be not so precise (but I think for most cases each second update is enough) and
  • batch can become larger, which can increase network load.

However, I think that for most cases these disadvantages are not important, but advantages are that

  • it is easier than set `event_time` property for each event
  • saves you from mistakes like if you forget to set this property.

What do you think?

Userlevel 5
Badge +3

@Dmytro Zasukha : there are some cases in which event properties and user properties are handled differently (like in Recommend, or Explore conversion drivers under funnel analysis), but those probably won’t matter in this case. Outside those there is nothing I can think of, but we haven’t really done anything like this with Amplitude ourselves, so I can’t speak from experience.

Can I ask what you are trying to do here?

Badge

@MikkoKarvonen, In my case, I want to use Amplitude to achieve a balanced in-game economy. Based on this article, to achieve it, I need to see the progress of an average user in each selected timeframe (seconds, minutes, hours, days etc.). The progress can consist of coins, crystals, levels, chests, monsters etc. The graphs, which I want to see, look like this (it is taken from the same article):


Do you think I can achieve this by just updating `seconds_active` user property each second? 

As far as I found, it will let me see my graph only in seconds (not in minutes, hours, days etc.) since Amplitude doesn't support it yet, as noted in this answer. However, it should be possible after exporting data from Amplitude and probably transforming data.


Userlevel 5
Badge +3

To be honest, the process described in the article looks more like an Excel exercise to me.

You’ll need data to verify that everything is progressing roughly as you expect, but second-by-second sounds bit extreme. All the example graphs have time in active minutes, too.

But the important detail here is that event_time in Amplitude won’t actually give you what you need, because you need active play time instead of real time. So I’d look into creating events for your key moments, and adding properties to track the total accumulated play time and the current status of all the resources in your game. That way you can do any cross-resource analysis you need.

Badge

Thank you, @MikkoKarvonen!

Just to clarify,

  1. I chose second-by-second as minimum because in the article at Step 5 “Decomposition” they suggest that for first-time user experience (FTUE) each second is important: 

Start decomposition by setting correct timeframes for future balancing:

  • The first-time user experience, which must be calculated for every second

  • The first day, calculated for each hour

  • The first week, calculated for each day


  1. Yes, I don’t need `event_time` property in my cause. I meant that I use `seconds_active` instead of `event_time` in my case. I saw it the same way as you suggested.

Thank you again for a fast and comprehensive response!

Badge

Update for anyone interested in tracking every second. There can be issue if you want to export data as CSV. It is possible that you can have more than 10000 seconds in your data which is the limit for Amplitude, at least for non-Enterprise version. It happened in my case, so probably I will have to use minutes additionally/instead.

Reply