This is in B2B Chat Analytics, I tried but don’t know if my answer is correct. Hope someone can help me with this. https://app.amplitude.com/analytics/demo/chart/hjqmr0zx/edit/cbmsp21w
Hi NitishKumar
Since this is demo data, some of the funnels might not actually show up in the data for your set of clauses and date range. Hence you are seeing a 0% rate in there.
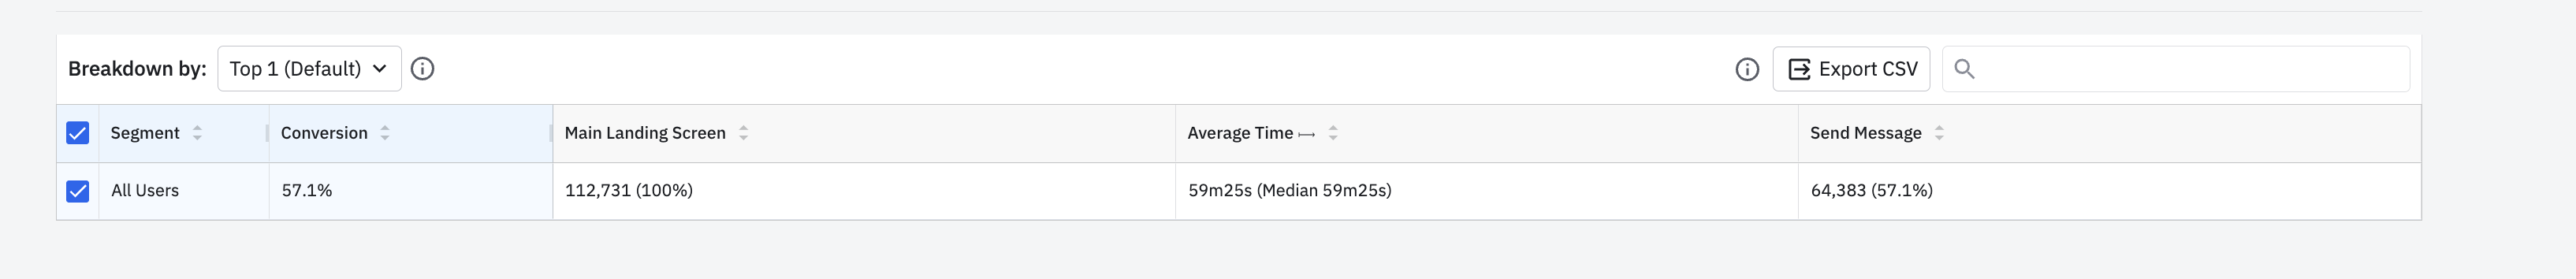
Here’s an alternate chart - https://app.amplitude.com/analytics/demo/chart/hjqmr0zx/edit/cm22r3mv
From this chart, you can pick up the following stats
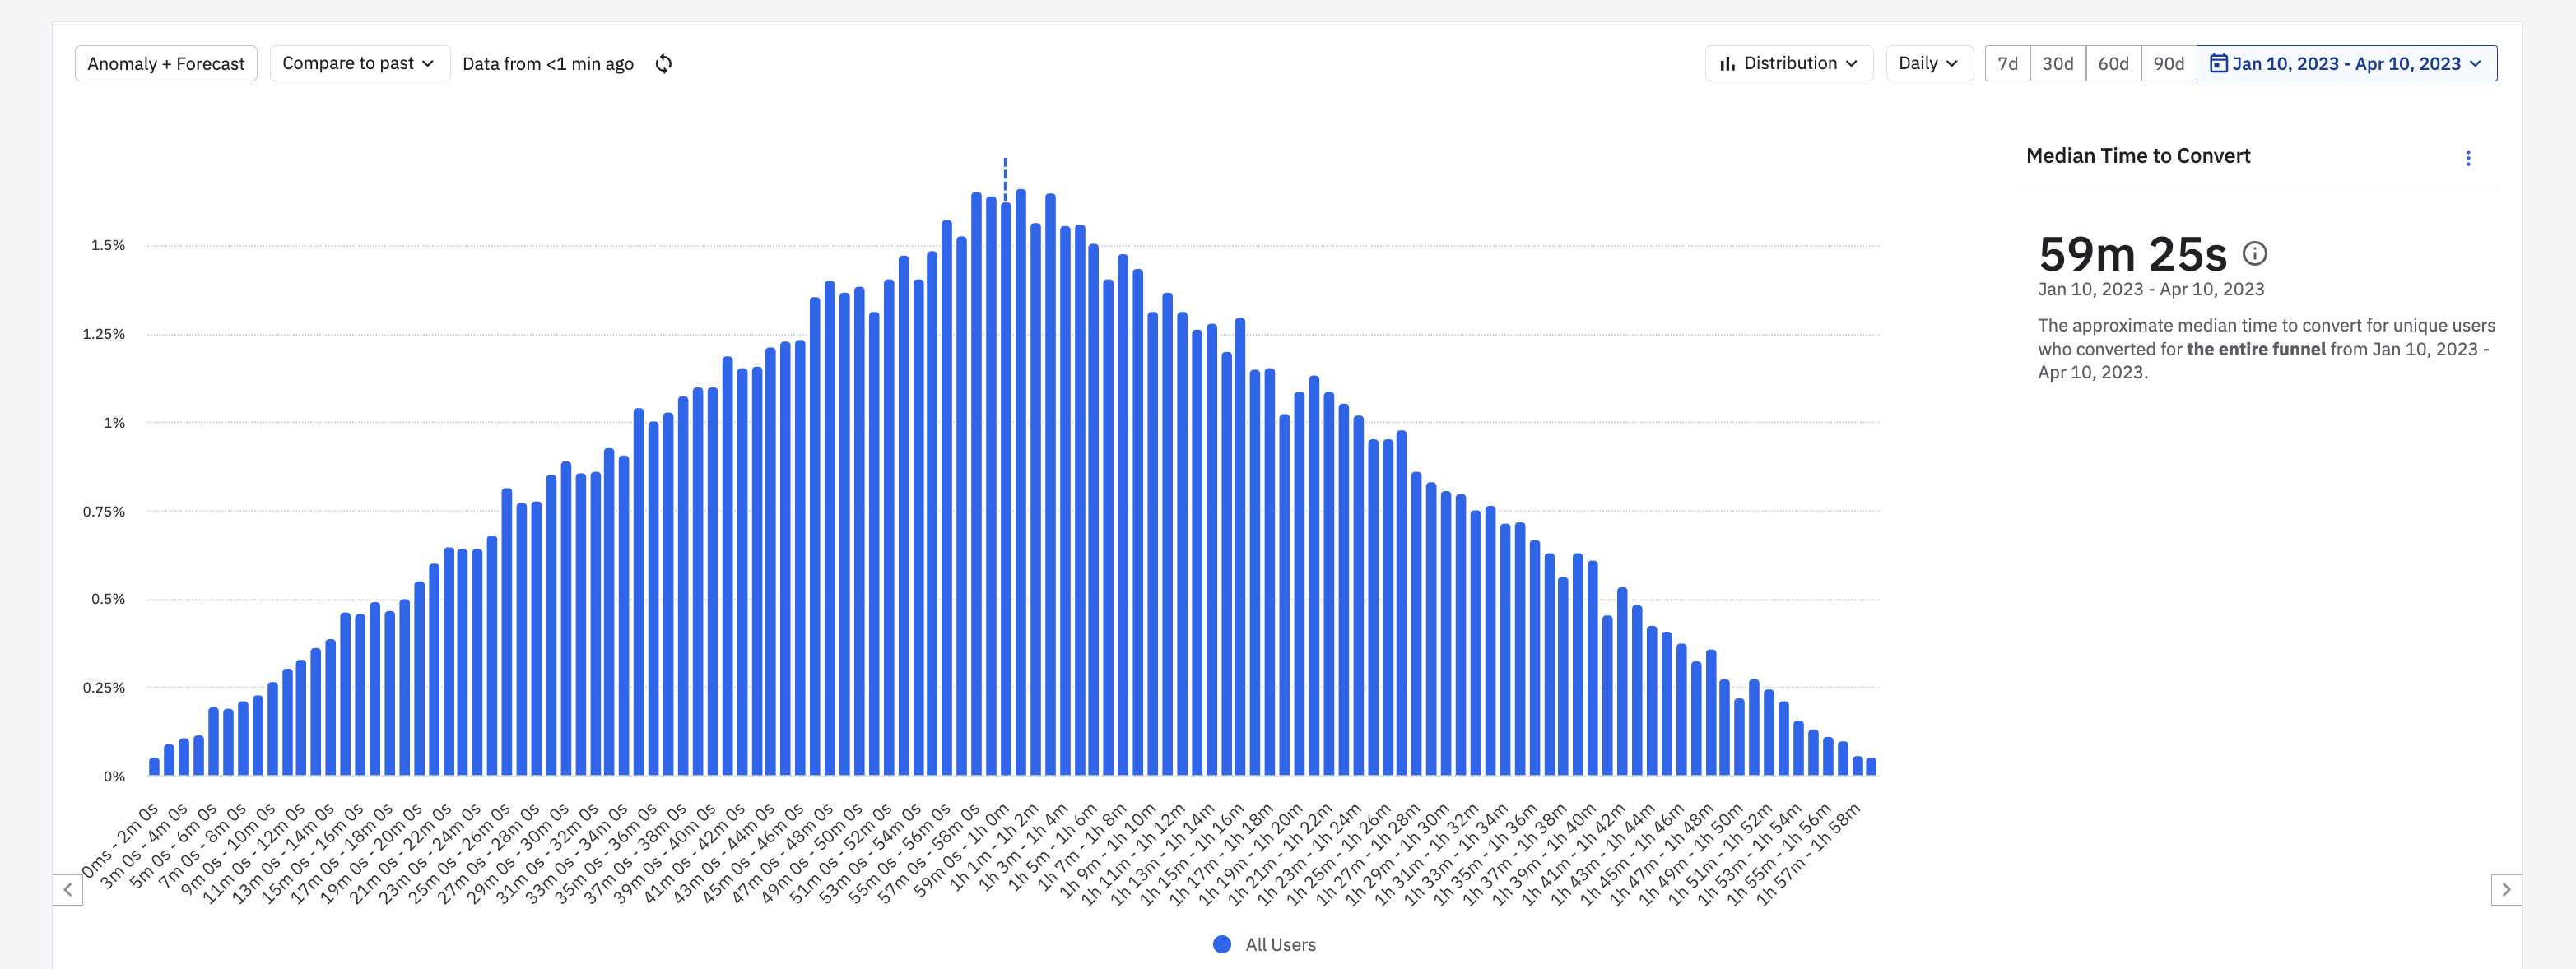
From the “Time to Convert” (distribution) view https://app.amplitude.com/analytics/demo/chart/hjqmr0zx/edit/vl3jcqcb-,
I would suggesting perusing through this doc for getting insights from your funnel charts - https://help.amplitude.com/hc/en-us/articles/360053338671-Interpret-your-funnel-analysis
Hope this helps.
Hello! In React-Native mobile project we have this error : Amplitude Logger [Error]: Failed to set cookie for key: AMP_TEST. Error: Cannot set property 'cookie' of undefined Error Component Stack: ``` The package version is "@amplitude /analytics-react-native": "1.5.16", Steps to Reproduce: Upgrading from version ^1.4.13…
We are running an experiment, and in charts seeing a higher number of exposures than assignments. When we drill into users who have an exposure and not an assignment, they do end up having an “Assignment” event in their user event stream. What is preventing them from being included in the roll-up assignment calculation?…
When im creating we experiment, there is option “Saved Pages” here… I searched everywhere and I could not find a single mention of this in docs and i could not figure out how to set this up. My goal is to define a list of pages, ideally by importing a csv. I know i could create rules, but defining that for tens or hundreds…
I am trying to integrate aplitude in my kotlin android application. My dashboad is on US servase zone. I am sure that i copied the right api key for my project but logs shows that the api key is invaled with the staus code 401 Amplitude( Configuration( apiKey = BuildConfig.AMPLITUDE, context = androidContext(), serverZone…
Hi everybody, I am running an experiment using the visual editor. I have made some copy changes to our subheading. However, when I land on the testing page, I can see the change from version A to version B happening in real-time. I already have a few colleagues complaining that it does not look good. Is there anything I…