I am creating a funnel & the conversion rate from step 1 to 2 is quite simple. But any step after the second it shows the conversion rate from the initial steps’ population. Can’t I see the conversion from the previous step?
Hey Antranik Andreh Kiloyan
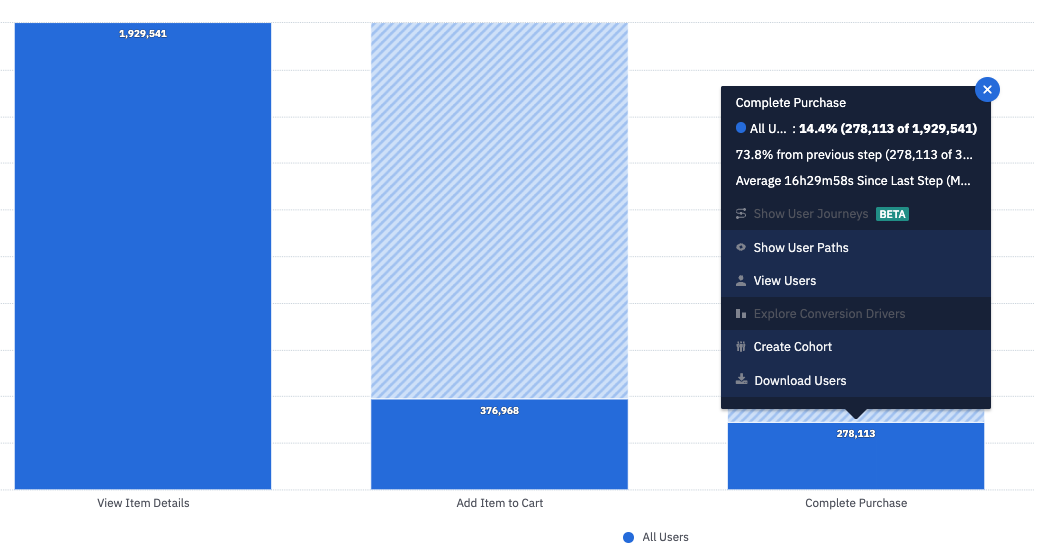
You are correct. The overall conversion rate shown in the chart is with reference to the first step’s population.
From what I know, the only way of looking at the conversion from previous step is to hover over the solid regions of the bar and locate the X% from previous step metric.
For the above demo chart, 73.8% is the conversion from previous step i.e step 2 and the overall conversion is shown as 14.4%
They also launched the Multiple Conversion over Time feature recently which could be useful.
Hope this helps.
Hi, When I add a chart (widget) to my dashboard, and then go to the content and modify the chart (I user another type for exemple) and save, my dashboard doesn't reflect the latest modification. Would you by any chance know why ? Thank you
Hi, I am doing a simple analysis : number of views for each pages of my website. So I use Segmentation but I always end up with a chart AND the table below. I want to display only the table (easier to read). Is it possible and how ? Thank you
We implemented first party tracking using the basic JS SDK on the browser and pointing the payload to our servers like this: amplitude.init(AMPLITUDE_API_KEY, { serverUrl: serverUrl, autocapture: { attribution: { excludeReferrers: [/domain1\.com$/, /domain2\.com$/], }, formInteractions: false, fileDownloads: false, }, });…
My Android app is primarily a background app. Does Amplitude track events for such an app? Please let me know.
here is the referance graph: https://app.amplitude.com/analytics/demo/chart/new/363tk5og In this graph, retention is currently being calculated based on the next day, but I want to analyze it based on the previous day instead. Example: For July 27, we should compare retention against July 26, not July 28. * So for 1-day…