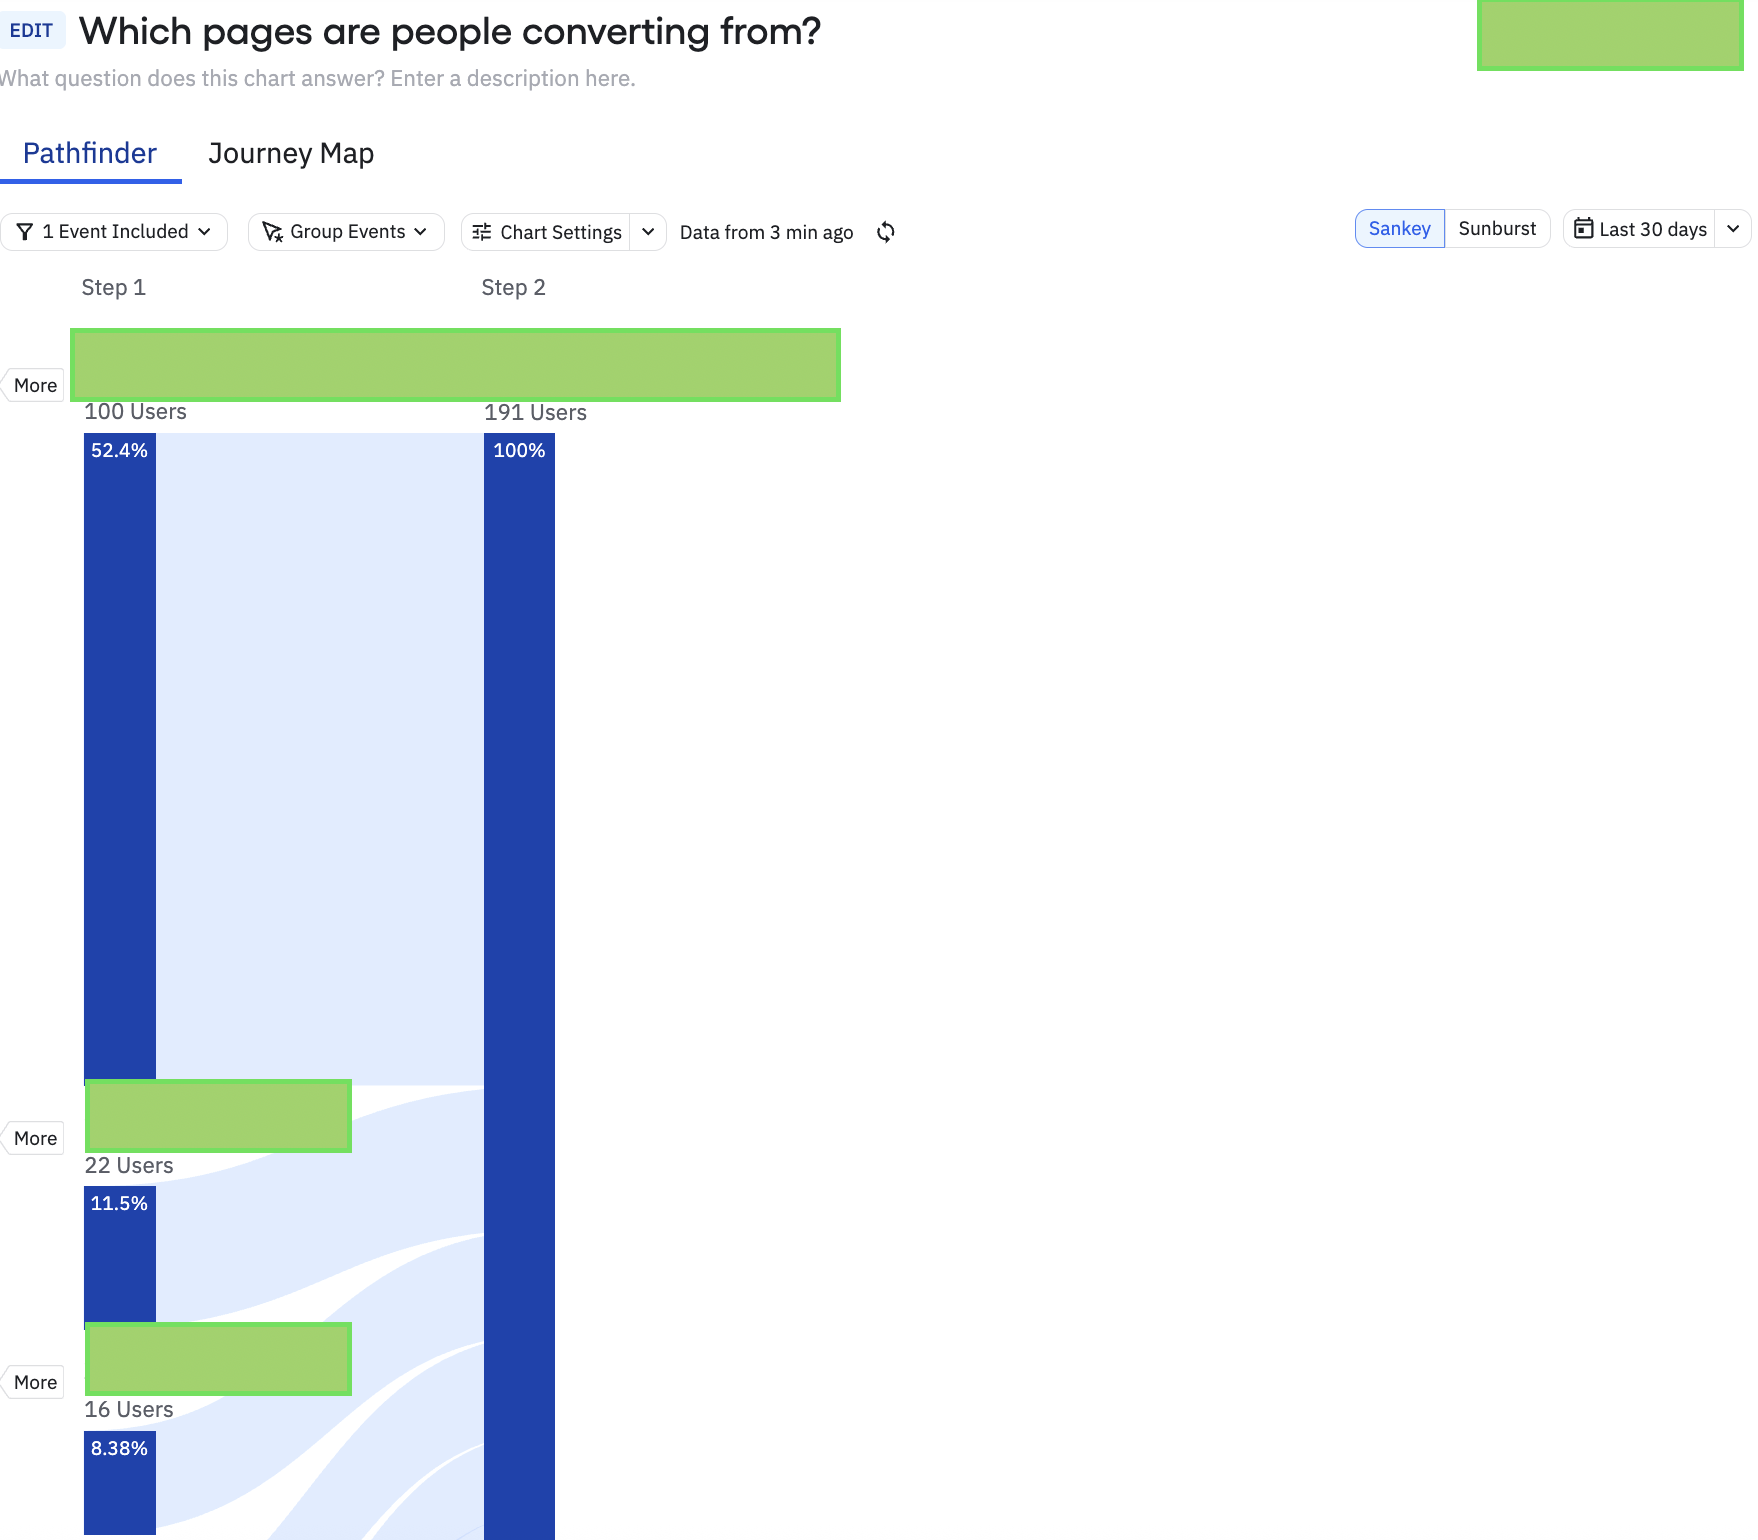
I have made this pathfinder journey chart. Works super well but for some reasons it's 2 pages long, despite being like 4-5 entry points. How do I make it more compact so I can see it at a glance in my dashboard?
Yeah the sunburst isn't a very legible view, and even the control minus isn't a very worthwhile solution. This feature should be rethought, half the real-estate is pointless just shows me one bar instead of the 7-8 top ones.
Hello! In React-Native mobile project we have error: Amplitude Logger [Error]: Failed to set cookie for key: AMP_TEST. Error: Cannot set property 'cookie' of undefined Error Component Stack: ``` The package version is "@amplitude/analytics-react-native": "1.5.1", Steps to Reproduce: * Initialize Amplitude with our API key…
We implemented first party tracking using the basic JS SDK on the browser and pointing the payload to our servers like this: amplitude.init(AMPLITUDE_API_KEY, { serverUrl: serverUrl, autocapture: { attribution: { excludeReferrers: [/domain1\.com$/, /domain2\.com$/], }, formInteractions: false, fileDownloads: false, }, });…
My Android app is primarily a background app. Does Amplitude track events for such an app? Please let me know.
here is the referance graph: https://app.amplitude.com/analytics/demo/chart/new/363tk5og In this graph, retention is currently being calculated based on the next day, but I want to analyze it based on the previous day instead. Example: For July 27, we should compare retention against July 26, not July 28. * So for 1-day…
Hi everybody! I need your help with a client request: my client is used to analyze landing pages performance with the standard report from GA4 and I need to create something similar in Amplitude. What I already have: * session entries grouped by page URL * purchase event calculated as session totals grouped by page URL and…