Solved

Inconsistent Stickiness and Retention

  • 10 September 2021
  • 6 replies
  • 399 views

Userlevel 1
Badge

Hi!


I’m new at using amplitude and I’m struggling to understand the relation between stickiness and retention.


I have set up a cohort with users that have a strong usage for a specific event (“AddToWishList” event), +5 events during july 2021, and at least one event (“AddToWishList” event) during august 2021.


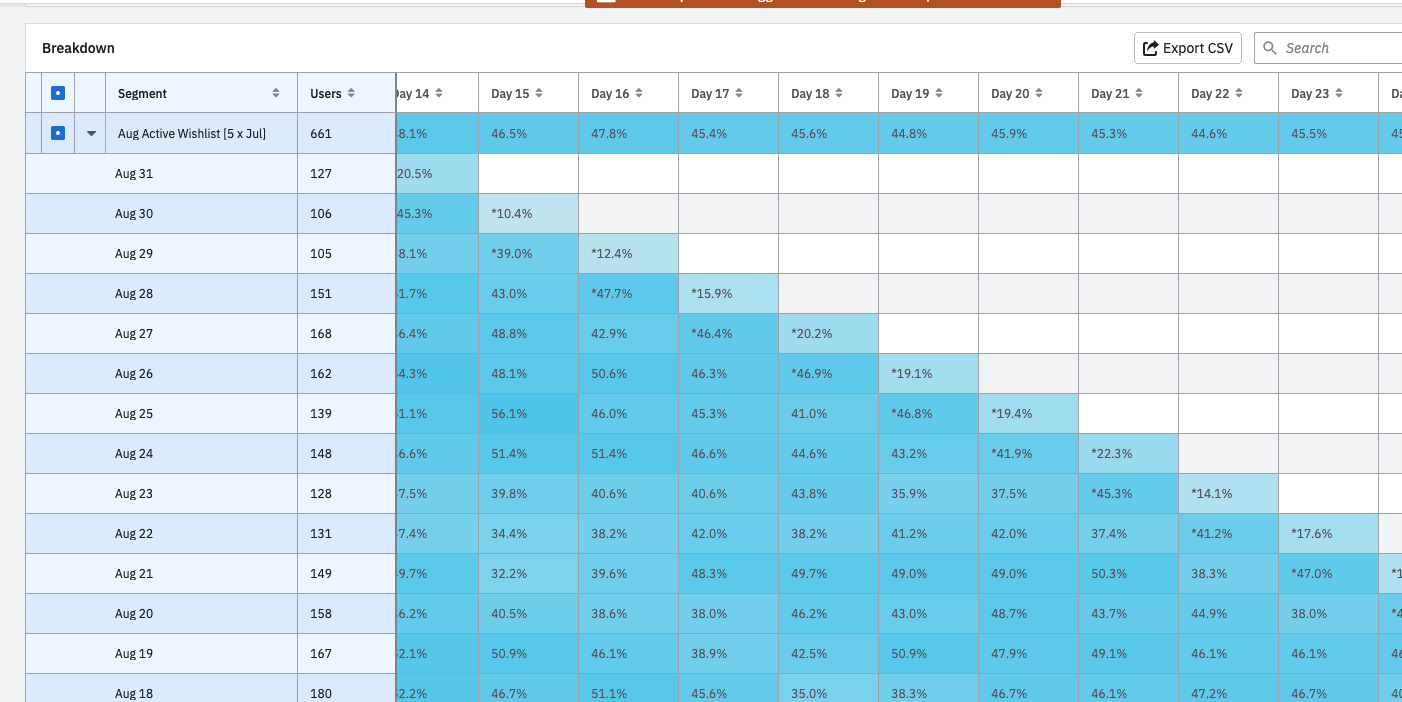
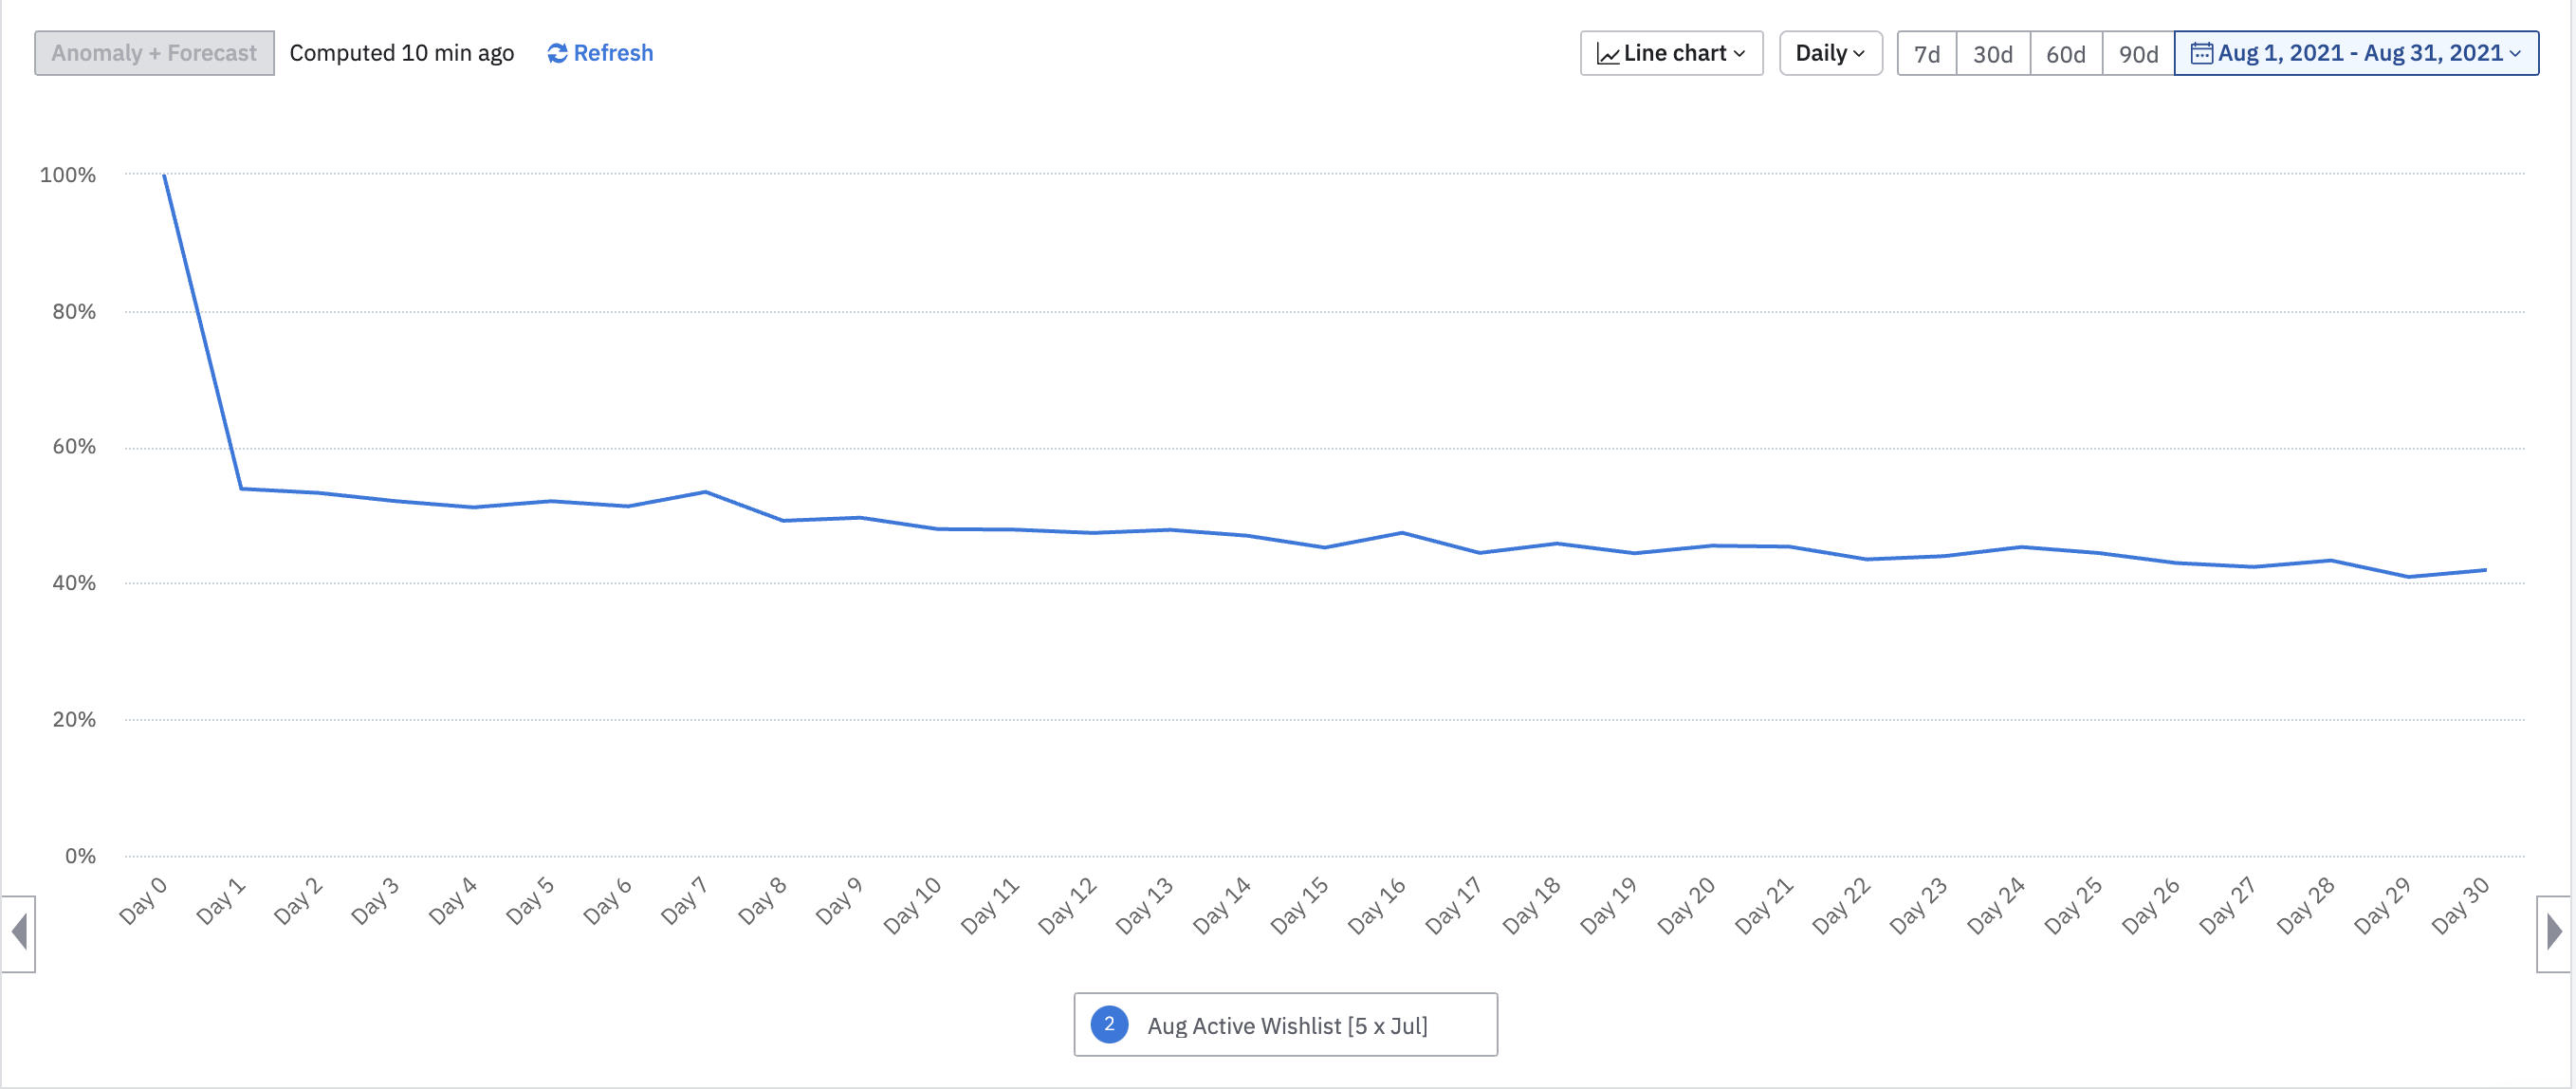
Then I plot a daily retention chart during the period of august 2021 for the same starting event and return event, i.e. “AddToWishList”. Our daily retention is over 40% for the entire period as the figure shows.


So far so good. Then I plot the stickiness chart for the same event and time period and cohort. The below chart shows that 18% of users from the segment have emit the event only once and only a few users really “sticked” with the event.


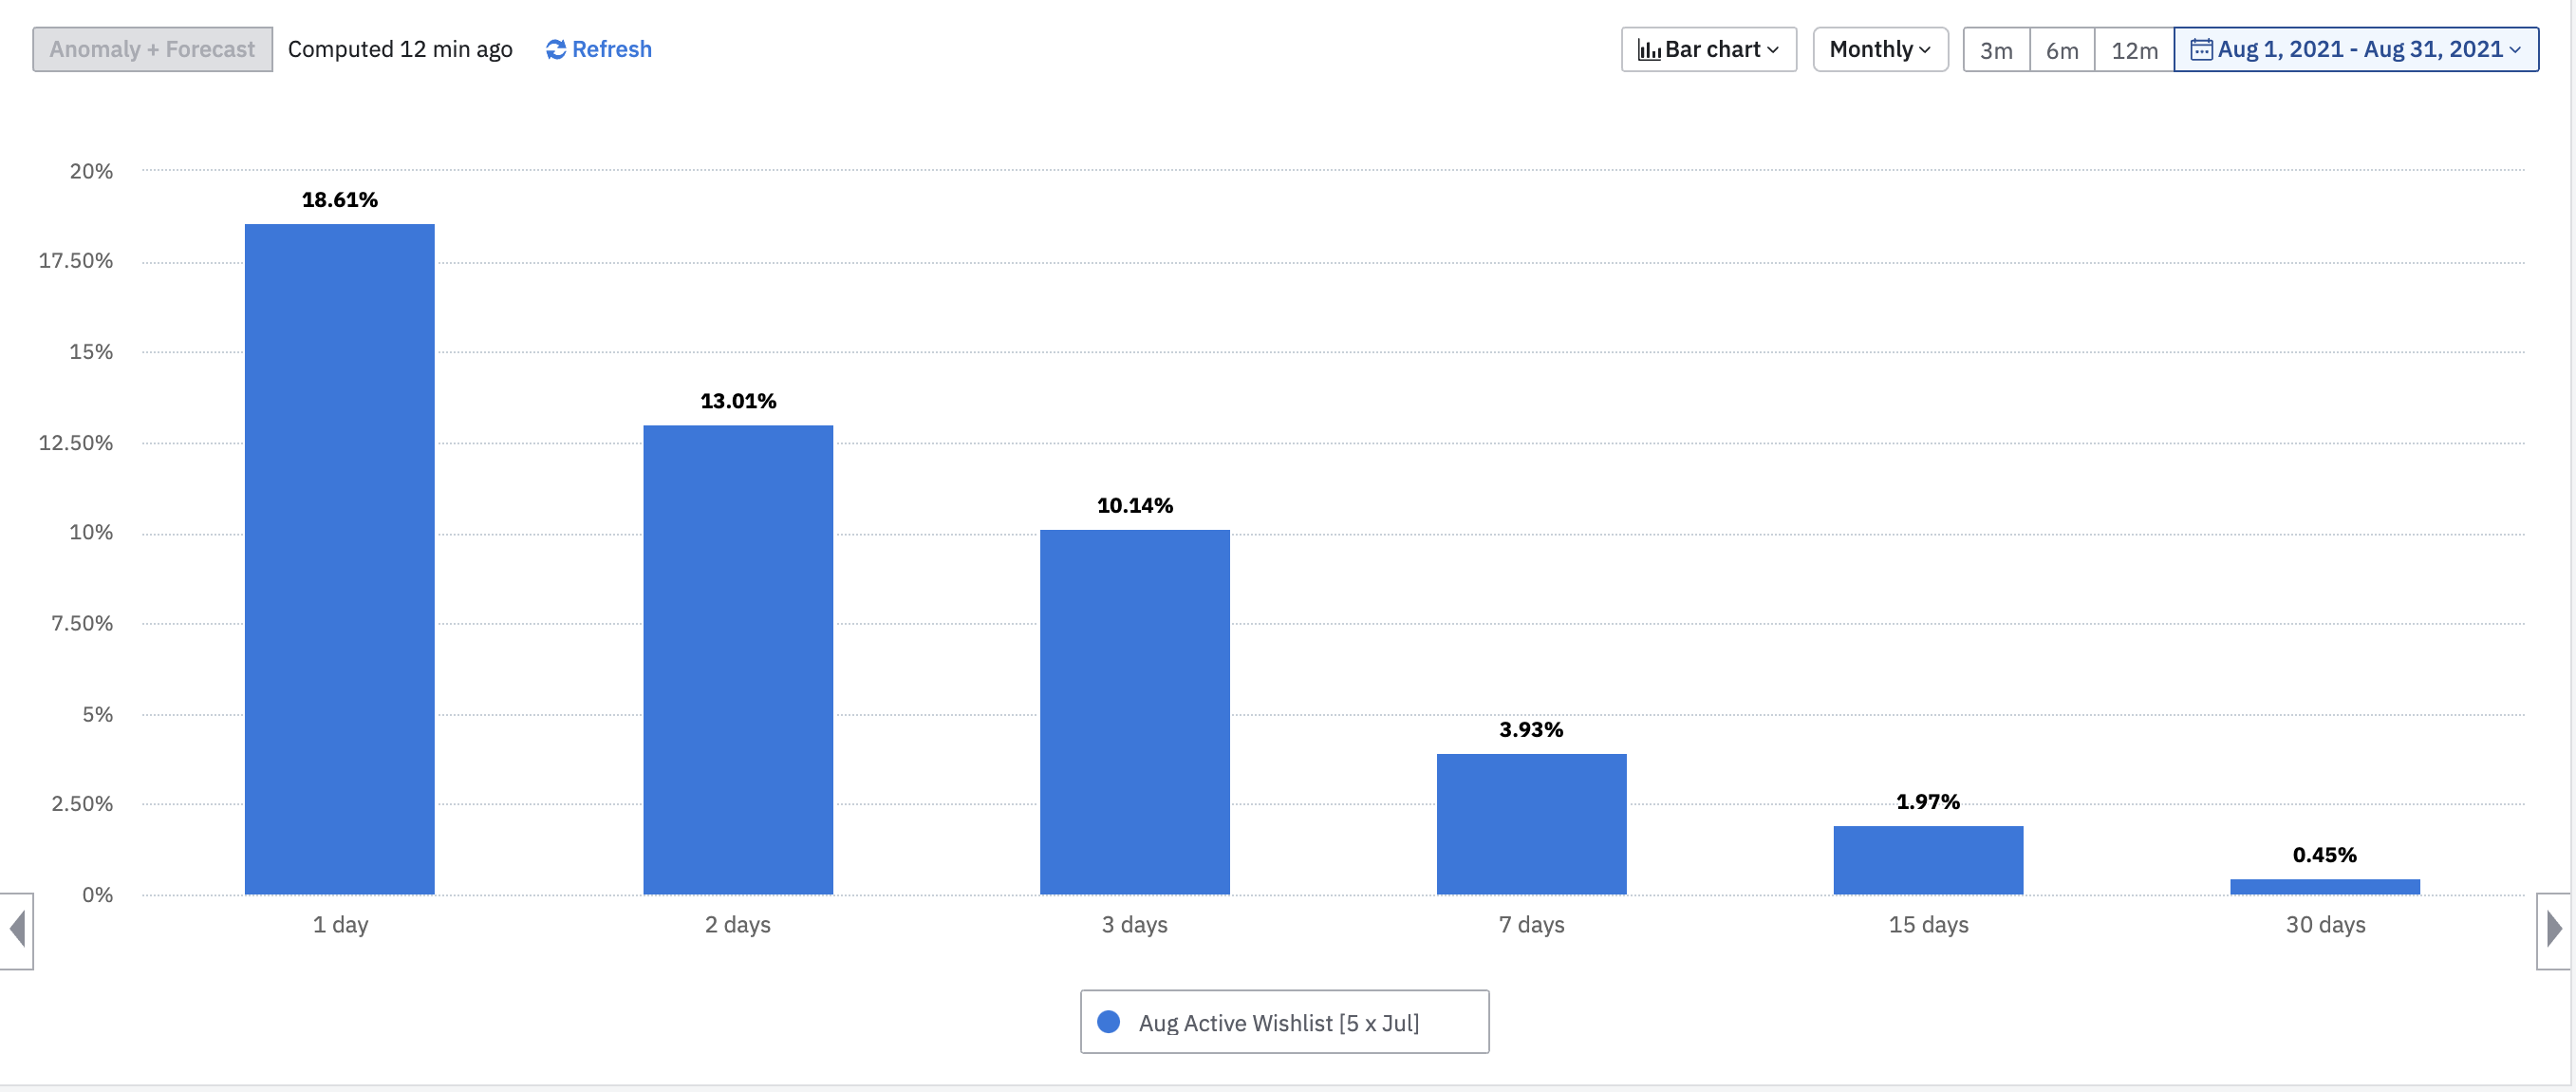
Given a +40% of retention for a given cohort, I would have expected a higher stickiness for the same event. This said, I expect users to have used at least 15 days during the same evaluation month.


Given the above information, what should be the interpretation? Is there an inconsistency between both analysis?


Please if someone could help me! Would really appreciate it! 🙂


Regards!

Santiago

icon

Best answer by Denis Holmes 14 September 2021, 20:47

View original

6 replies

Badge

To answer your question, need additional informations. 

  • What is the retention you are looking at. N day retention or Unbounded retention ?
  • Are you looking to the cumulative or non cumulative stickiness ? 
Userlevel 6
Badge +8

Hi @stgo.larrain , 


Would you be so kind as to send us the link to the two charts you are looking at? In the meantime, I recommend reviewing this article on stickiness as well as this article on retention. We can then take a look at the charts and see why this is the case. Thank you!

Userlevel 1
Badge

Hi @Denis Holmes!


Thanks for your response. I have read your suggested articles and still doesn’t make sense… perhaps I have a miss configuration.


Here are the link to both charts as you requested:

Stickiness: https://analytics.amplitude.com/vestua/chart/7aln69m

Retention Analysis: https://analytics.amplitude.com/vestua/chart/uofcbzu


Not sure if I have to configure some permissions in order for you to see the links above. Just let me know if it works.


In response to @kays1234 . The retention analysis is done with the N-Day Retention metric and the stickiness is computed as non cumulative. Thanks to you for your response.


Best regards!

Santiago.

Badge

@stgo.larrain c

Userlevel 6
Badge +8

Hey @stgo.larrain ,


Thank you for reading the articles and for the links! No permissions needed, thank you for the consideration! Let’s get to work so!

Stickiness: https://analytics.amplitude.com/vestua/chart/7aln69m

First, let us focus on your stickiness chart. Stickiness is for showing you how often users fire specific events over a given period of time. In your chart we are focusing on the cohort showing users who purchased 5 times in July, yes? I can’t see the cohort but I am guessing from the others. We want to see how often users are firing AddToWishList in August. The non-cumulative Stickiness chart (yours!) shows you the percentage of users who fired the event at least once on the exact number of days listed on the X-axis. So, targeting the cohort, there were 661 unique users who triggered this event. Out of that 661, 18.4% triggered AddToWishList once in August, on only one day. 2.12% triggered it 15 days of the month, meaning 2.12% of users came every second day to trigger it. So it is looking at how many times they are triggering this event. Please note, users can appear i more than one bucket. 

Retention Analysis: https://analytics.amplitude.com/vestua/chart/uofcbzu

The retention chart helps you drive product adoption by showing you how often users return to your product after taking a specific action (known as firing an event). We’re looking for users who did the event AddToWishList and came back and fired the return event of AddToWishList. Targeting the same cohort, same month and using N-day retention. N-day retention shows you what users came back to fire the event on a specific day. 24-hour windows mean we do not use calendar days to denote when one day ends but 24 hour rolling periods. Let’s say we have User A triggers Event X on 05:00 Tuesday. He then fires the return event on 00:01 wednesday, 19 hours later on the Wednesday. He would still be day 0 retained (same day) as 24 hours did not pass and we are going off that, not calendar. Here we are looking at how often does it take them to return, and not on how many days are they doing a certain event. Go to your breakdown chart and expand it like below ;


Let’s go to the bottom, Aug 1st with 198 Users. We can see 100% of these users triggered the event within 24 hours of triggering the first. 50%, 99, triggered it within 24-48 hours. 30 days from August 1st would be 31, which has passed, so let’s go to the end of this row. We see that 38.4% of 198 users from that cohort came back on day 30 and triggered that event. Not that they necessarily did this every day for 30 days. 

Let’s pop up to August the 15th. 149 users from the cohort. All of them triggered the event on Day 0, rolling hours. Well, day 30 from then would be the end of today, right? So we can see 12.4% have come back, 30 days from August 15th, and triggered the return event. However, note the asterix. This means data is not finished completing and some users may still have events to send (also it is not fully 30 days since August 15th yet!).

Let’s pop up to August 31st! Since August 31st, about 14 days have passed, so this is the maximum return time we can see. Our last day in the chart is August 31st. If we want to see which users are day 30 retained, we will have to wait until the end of September ! We can only see the users who triggered the event on August 31st and have come back each day and triggered it. For example, Day 2 after, 55.1% came back and triggered the event. So far, we know that users from that cohort who triggered the event on August 31st, 20.5%came back today, Day 15, and triggered the event!


I hope this explains the situation for you! Let me know if there is still any confusion!


Kind Regards,
Denis

Userlevel 1
Badge

Thanks @Denis Holmes for your kind explanation!


Now I see it clearly.


Regards,

Santiago.

Reply