Solved

A bug or I didin't understood the unbounded retention?

  • 14 July 2021
  • 4 replies
  • 245 views

Badge

Hey community, I might have a silly question but still I couldn’t find an answer myself so here I am.

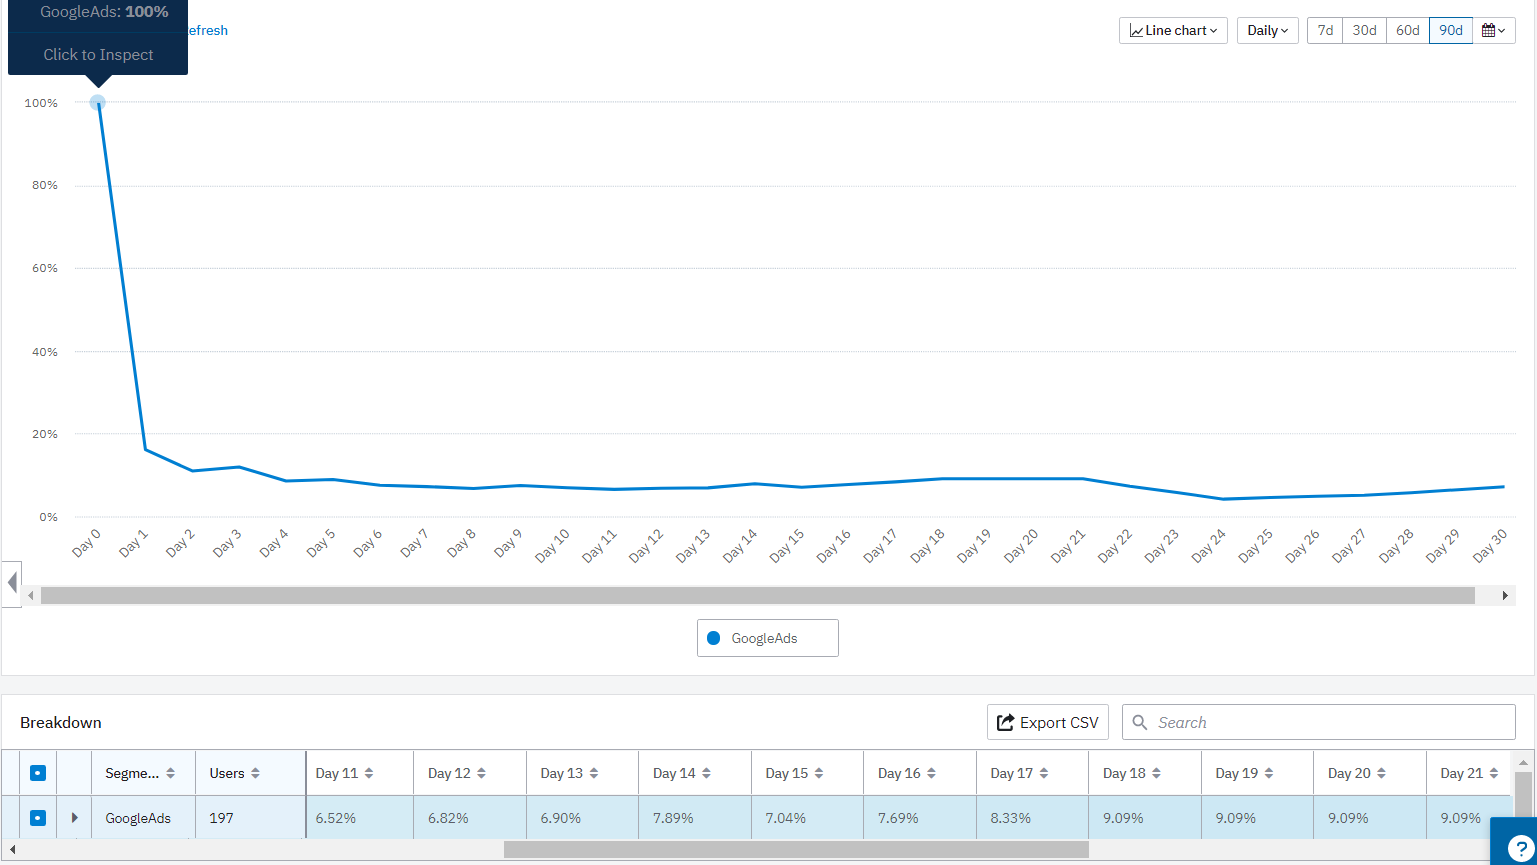
On many retention graphs that I created when I switch to the unbounded retention I see areas where the graph goes up, meaning that the number of people returned on the day n+1 is greater than on the day n, which, if I got the defenition of the unbounded retention right, is impossible.

Can you please help me with this puzzle?

Thanks!

icon

Best answer by Saish Redkar 14 July 2021, 18:28

View original

4 replies

Userlevel 7
Badge +10

Hey @MichaelK ,

A totally fair puzzle this one :)

Here is a similar post which might help you answer your question -


Hope this one helps!

Badge

Hey @MichaelK ,

A totally fair puzzle this one :)

Here is a similar post which might help you answer your question -


Hope this one helps!

Hi Saish, thanks for the direction. I puzzled a bit over this post and it seems that it doesn’t adress my question. It explains small discrepancies between N-day and unbounded retention, but doesn’t provide an answer as to why unbounded retention can go up. even if there are some nuances in how it’s calculated, the number of users that came back on the 10th day should not be greater then on the 18th day.


Would appreciate some guidence here.


Thanks

Userlevel 7
Badge +10

Hey @MichaelK ,

Sure. One of the common reasons for the retention to go up will be if the timeframe has incomplete data points owing to the uneven user counts within each day.

I found Belinda's post here which explains this behavior in detail. Hope that can clarify further.


Userlevel 5
Badge +3

even if there are some nuances in how it’s calculated, the number of users that came back on the 10th day should not be greater then on the 18th day.

This is a tough one to wrap your head around (I know I struggled with exactly the same question for a good while myself), but the links @Saish Redkar has given do include the key: uneven sample sizes.

Here’s a simplified example:
 

New Users / Returning Day 1 Day 2 Day 3 Day 4
Day 1 10 10 5 (10 for unbounded) 10
Day 2 20 4 (5 for unbounded) 5  
Day 3 45 10    
Day 4 100      


This would give you the following retention values:
Day 1: 100%
Day 2: 33,3%
Day 3: 50%
Day 4: 100%

Essentially, Day 10 and Day 20 in your chart are calculated with different sized cohorts.

The more users you have or the longer period of time you are looking at, i.e. the larger your sample sizes are, the less you should see this effect.

Reply