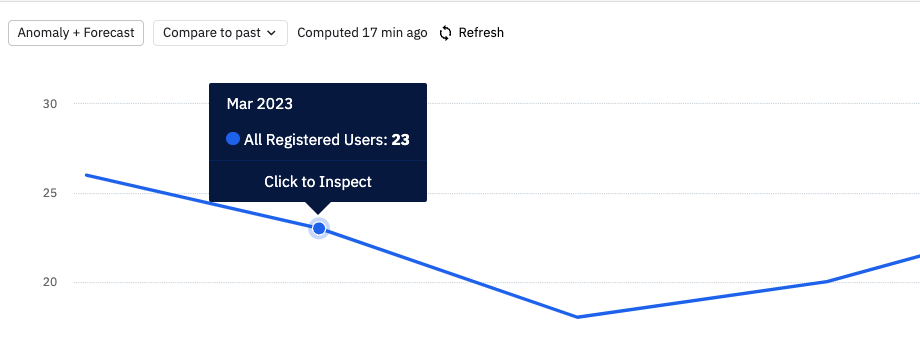
I’m looking the track the numbers of customers lost in each month via line chart. Ideally I’d want to be able to subtract the value of this chart in February with the value in January for the same event. How is this possible in Amplitude?
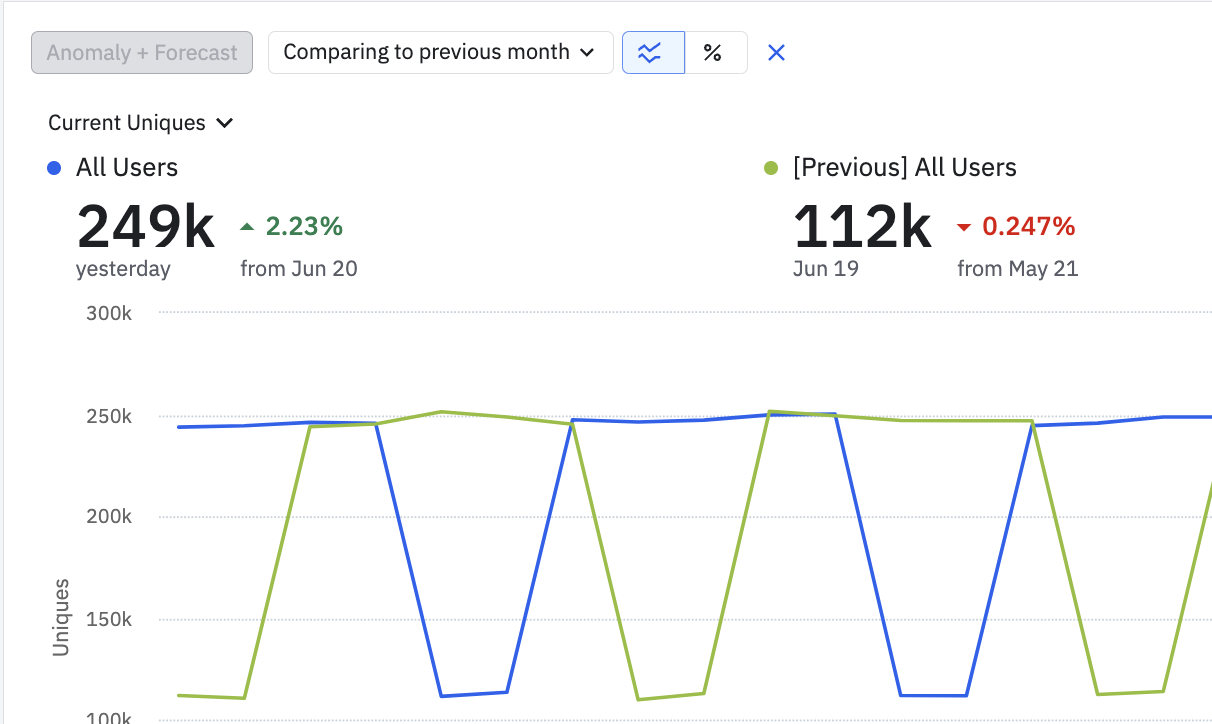
Hi Kashif! While it’s currently not possible to have the chart display the numeric difference between February and January, you can compare the difference visually and see the percent difference. To do this, click “compare to past” at the top lefthand corner of the chart.
We implemented first party tracking using the basic JS SDK on the browser and pointing the payload to our servers like this: amplitude.init(AMPLITUDE_API_KEY, { serverUrl: serverUrl, autocapture: { attribution: { excludeReferrers: [/domain1\.com$/, /domain2\.com$/], }, formInteractions: false, fileDownloads: false, }, });…
My Android app is primarily a background app. Does Amplitude track events for such an app? Please let me know.
here is the referance graph: https://app.amplitude.com/analytics/demo/chart/new/363tk5og In this graph, retention is currently being calculated based on the next day, but I want to analyze it based on the previous day instead. Example: For July 27, we should compare retention against July 26, not July 28. * So for 1-day…
Hi everybody! I need your help with a client request: my client is used to analyze landing pages performance with the standard report from GA4 and I need to create something similar in Amplitude. What I already have: * session entries grouped by page URL * purchase event calculated as session totals grouped by page URL and…
Good day! I am new to Amplitude and still learning. Our organization’s current objective is to track specific webpages that have high exits/drop-offs so we think that the Funnel Chart is the best tool to use for it. However, you see our website uses 2 different domains in completing the buying journey of visitors (from…