Hi @Eduard
Thank you for writing this post. I am copying what we have communicated via email here to help other customers who may have the same questions.
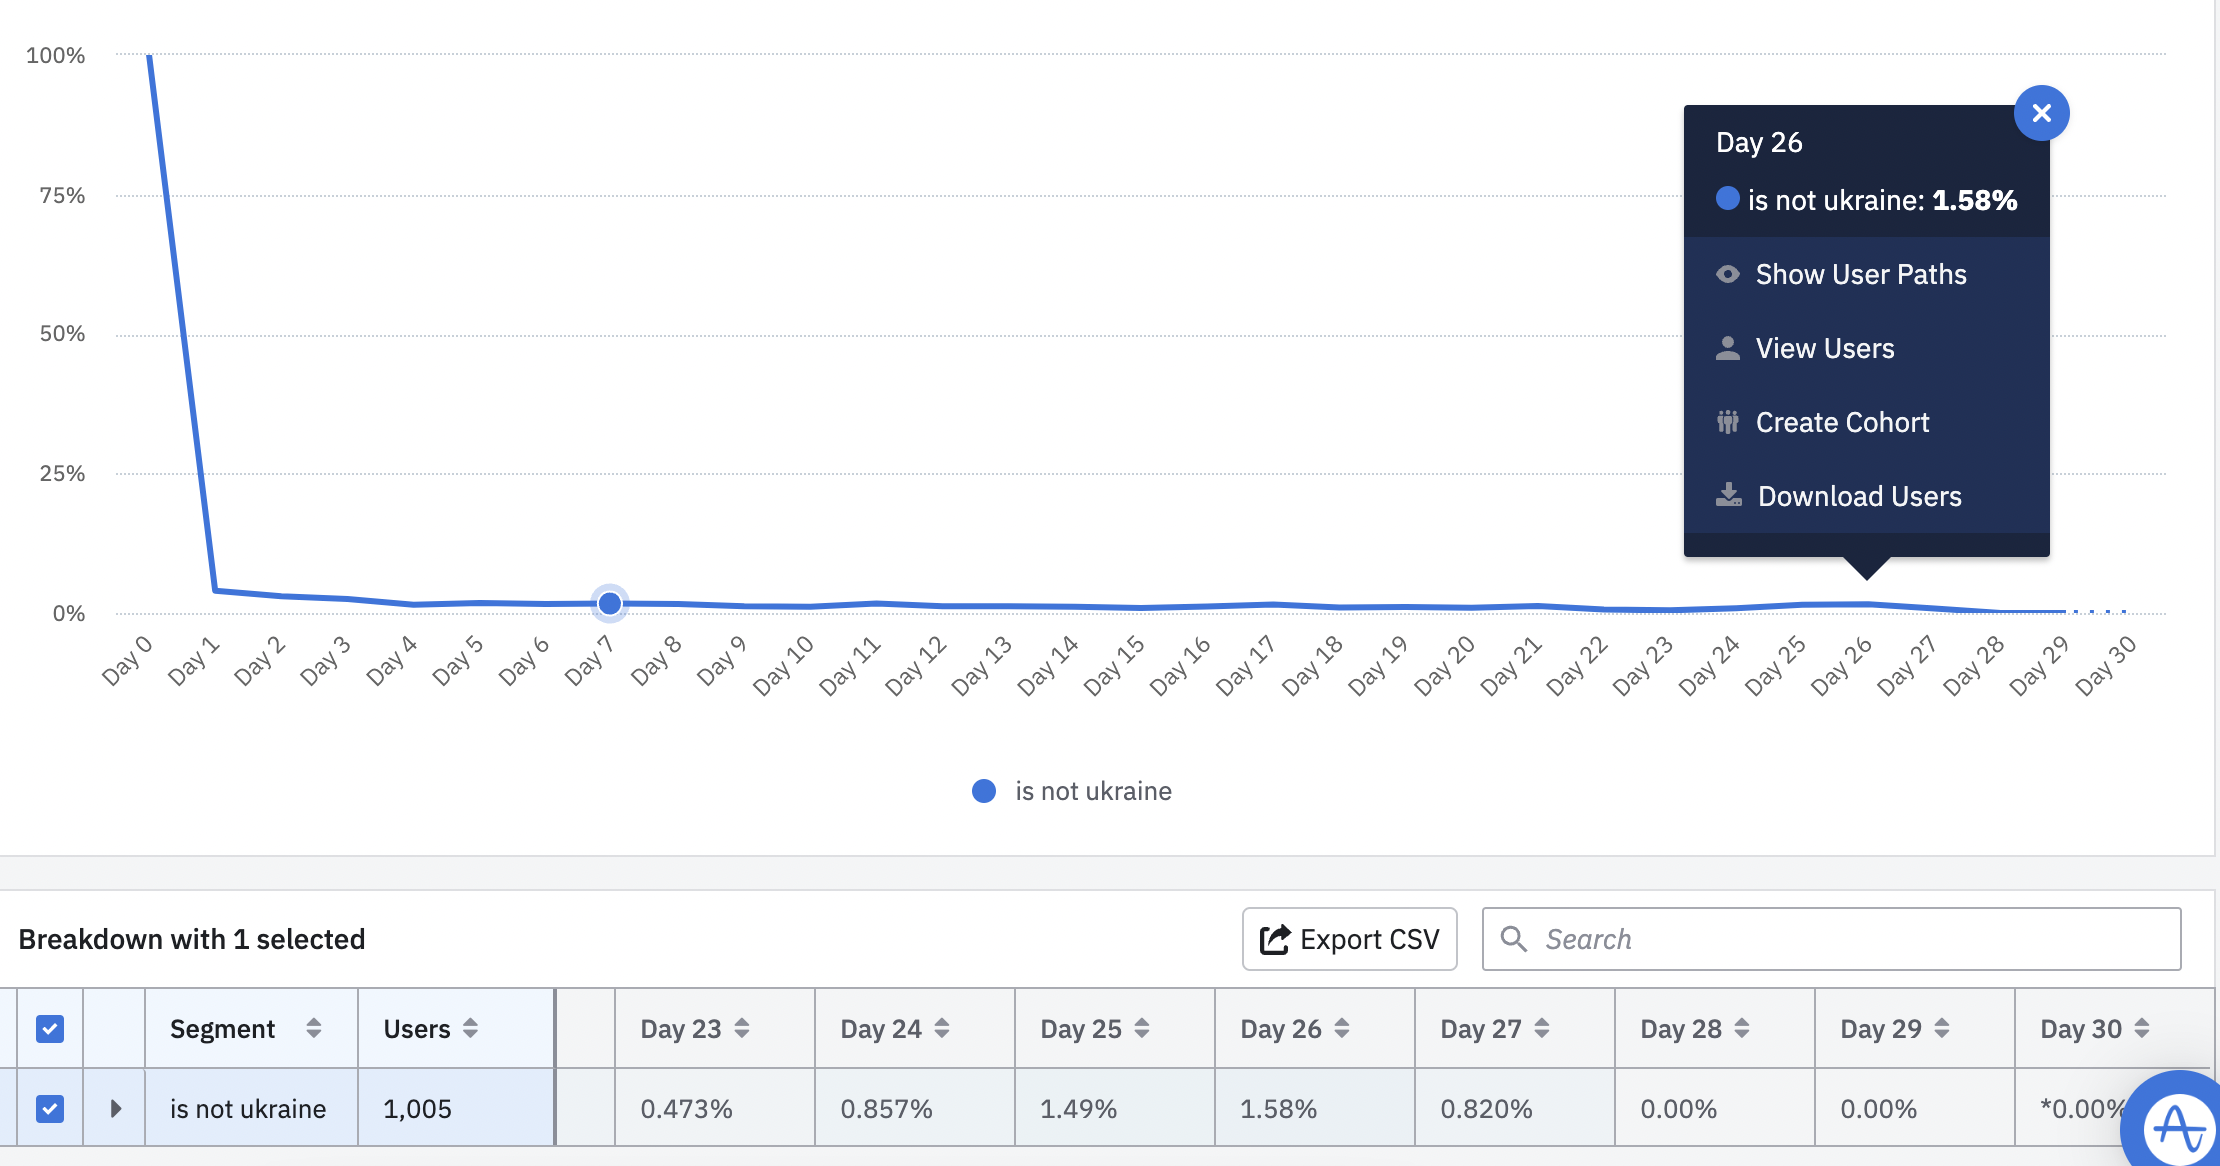
1. Retention report says that there are 1,58% of users who came back on 26 day.
*screenshot 1*
The numbers of users at cohort is 1005, so there should be 1005*1,58%=16 users who returned at day 26
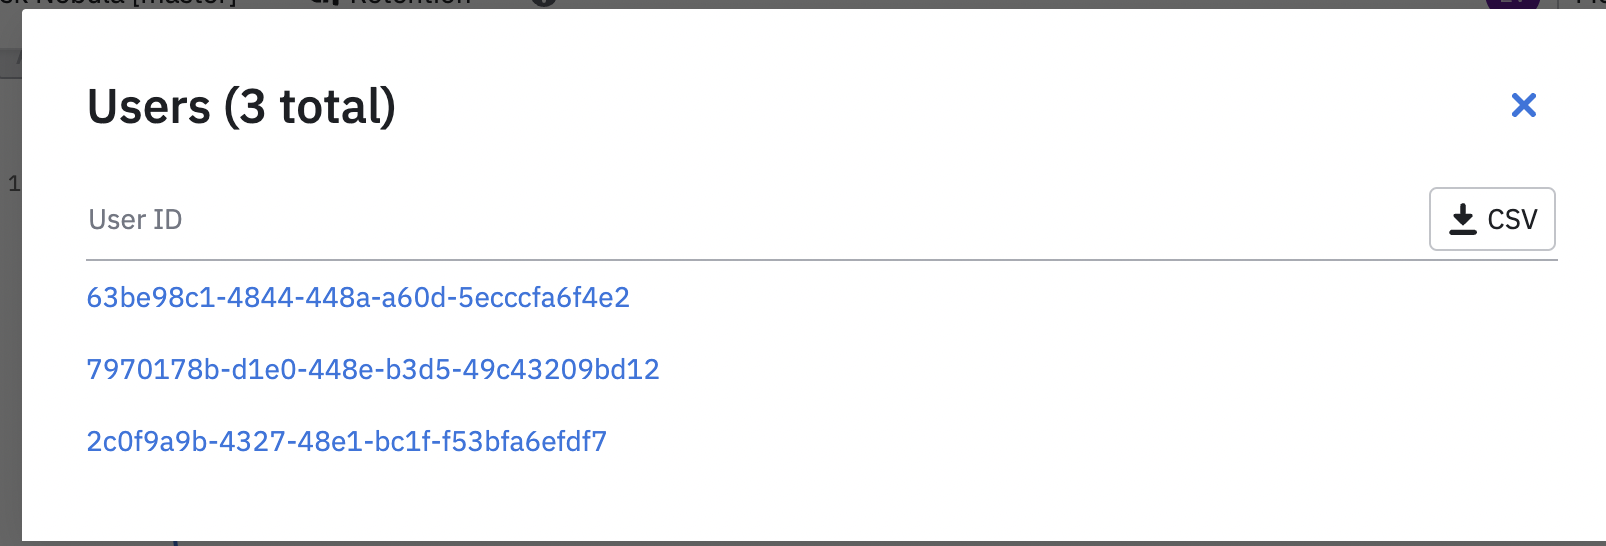
2. If i click at “view users” at day 26, i can see that there is only 3 users which is not the same as 16 at the previous bullet
*screenshot 2*
1,58% of the retention rate is not calculated based on 1005 users. 1005 is the total number of users that fall into this retention since Apr 4, but they can enter this analysis on different days. That would mean many users have not had enough time to reach their day 26. For example, User A became a new user on May 1. Day 26 retention for this user will only be calculated on May 27. So the day 26 retention is based on incomplete data.
As you can see from the screenshot above, there are many blank cells for column day 26 because no data is coming in yet for those cells. Only the users (49+46+46+15=156) in the red box are counted for the day 26 retention. I am seeing 1.54% retention at this moment for day 26, so the number of users who were retained so far is: 156*1.54% = 2.4, which rounds up to 3.
If i download a CSV of that users and calculate retention, the number of returned users at d26 is 4 which is 0,32% from number of users at cohort (1232). Also number of users at cohort is different from the number on chart (1005 and 1232)
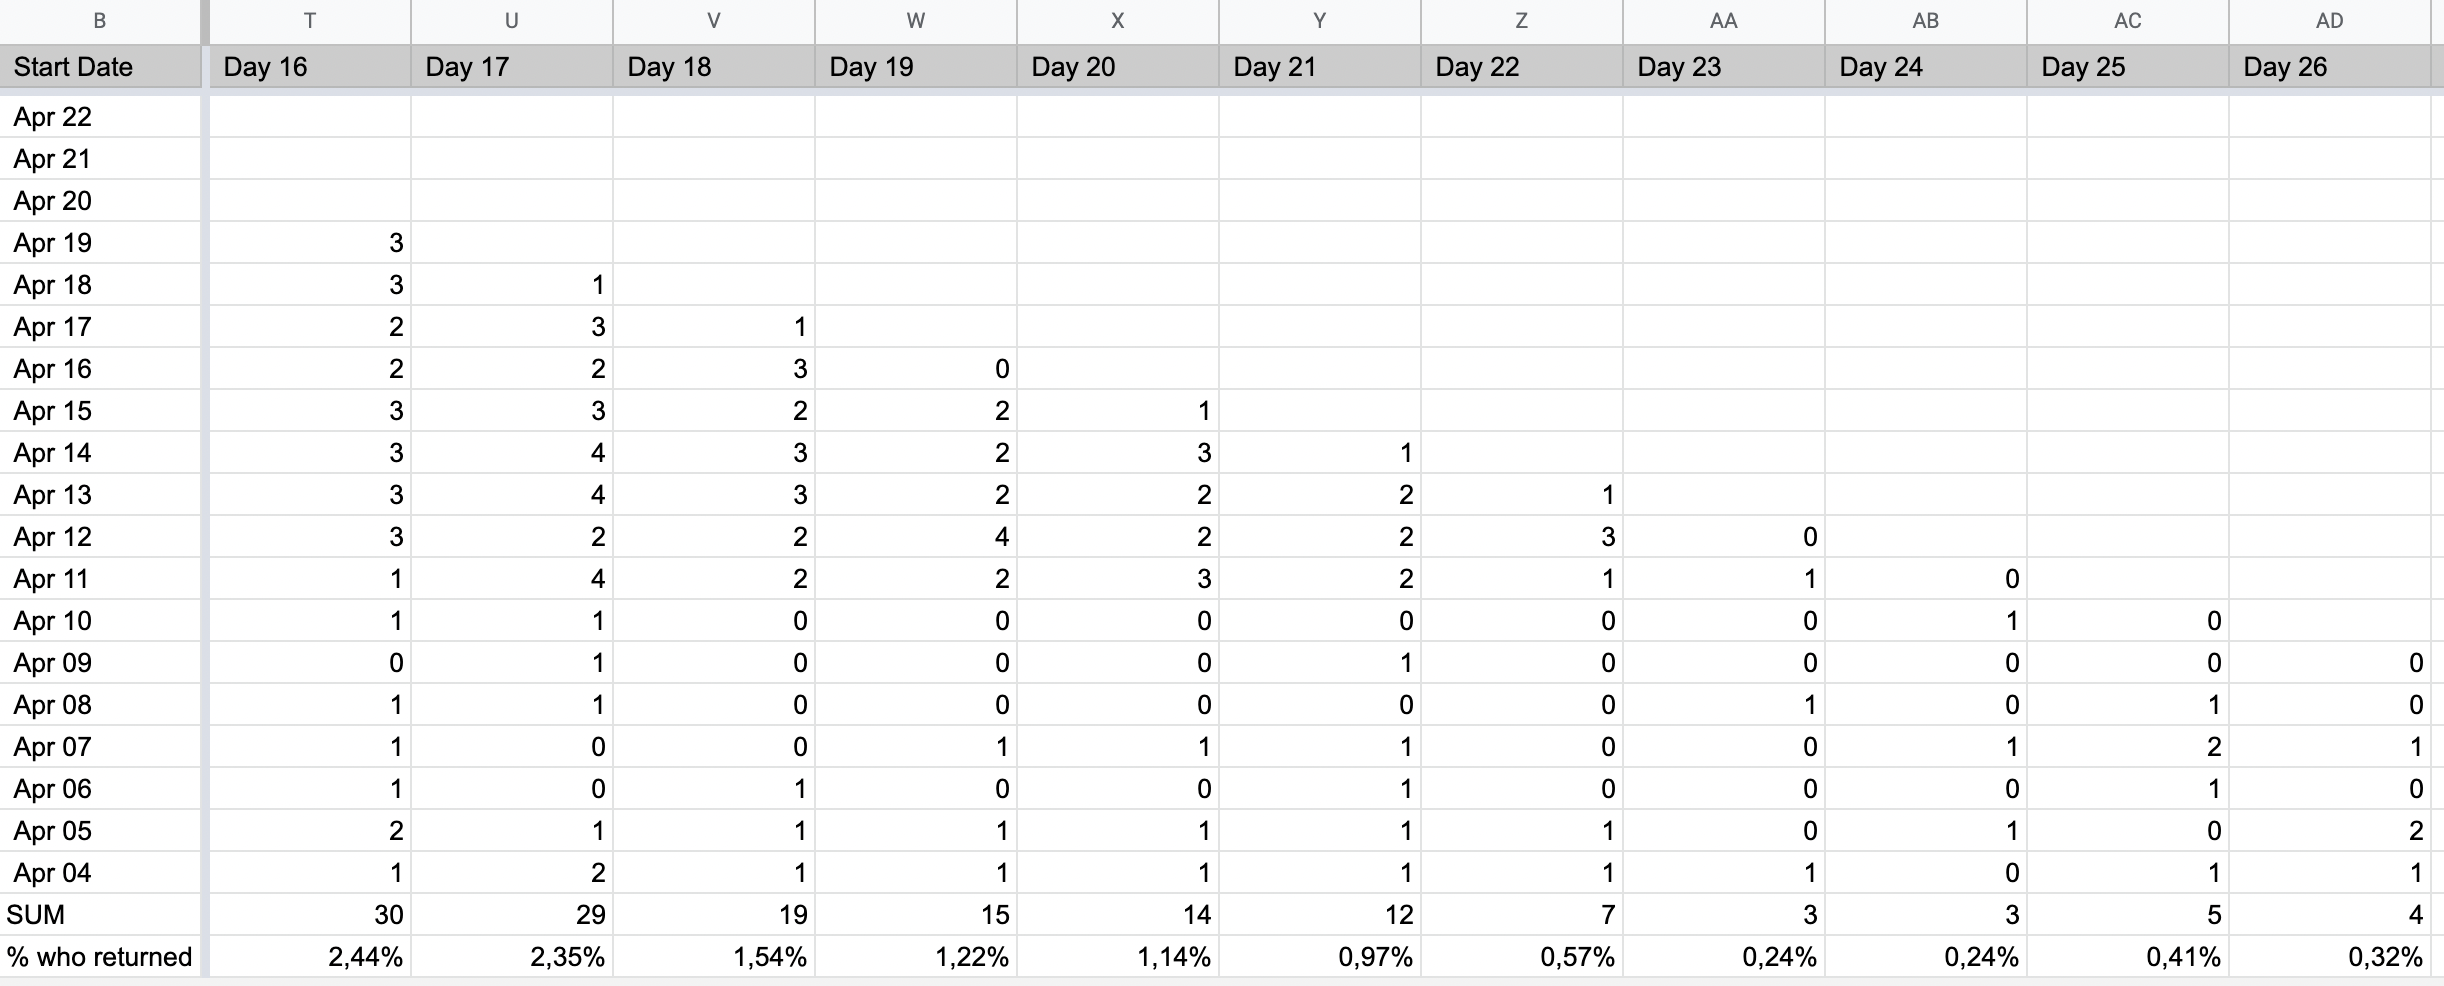
*screenshot 3*. Link to CSV calculation - https://docs.google.com/spreadsheets/d/13ygjtBUnkxmICkx07ZtksUiFu2mPbeZLvbTABDNxnbw/edit?usp=sharing
Our retention line graph shows you the deduplicated weighted average of retention rates within the selected time frame. But the calculation you did with the exported CSV is unweighted average without taking into account that one person can enter the retention more than once. One user can be counted in the day 26 returned number on both April 4 and April 5, but in the total retention rate, this user will only be counted once. So for sure the 4 users you see in the CSV counted one of the users twice.
Which data is correct? If I’m analyzing that report in incorrect way, tell me which one is correct.
To summarize, the chart you build is correct and working as expected, and the 1.54% and 3 are the correct number for day 26 with consideration that the data sample is incomplete.
I hope this is helpful to you. Please let me know if you have follow-up questions!
Best,