Hi everyone,
Thanks in advance for your help. I am having some trouble with the way my charts are displayed within a dashboard.
For example, in the screenshot below, I have created a segmentation chart to see Which are the most viewed products for a particular brand. I measured the data as cumulative total events ordered the rows by Row Sum as can be seen in the right most column of the table below.

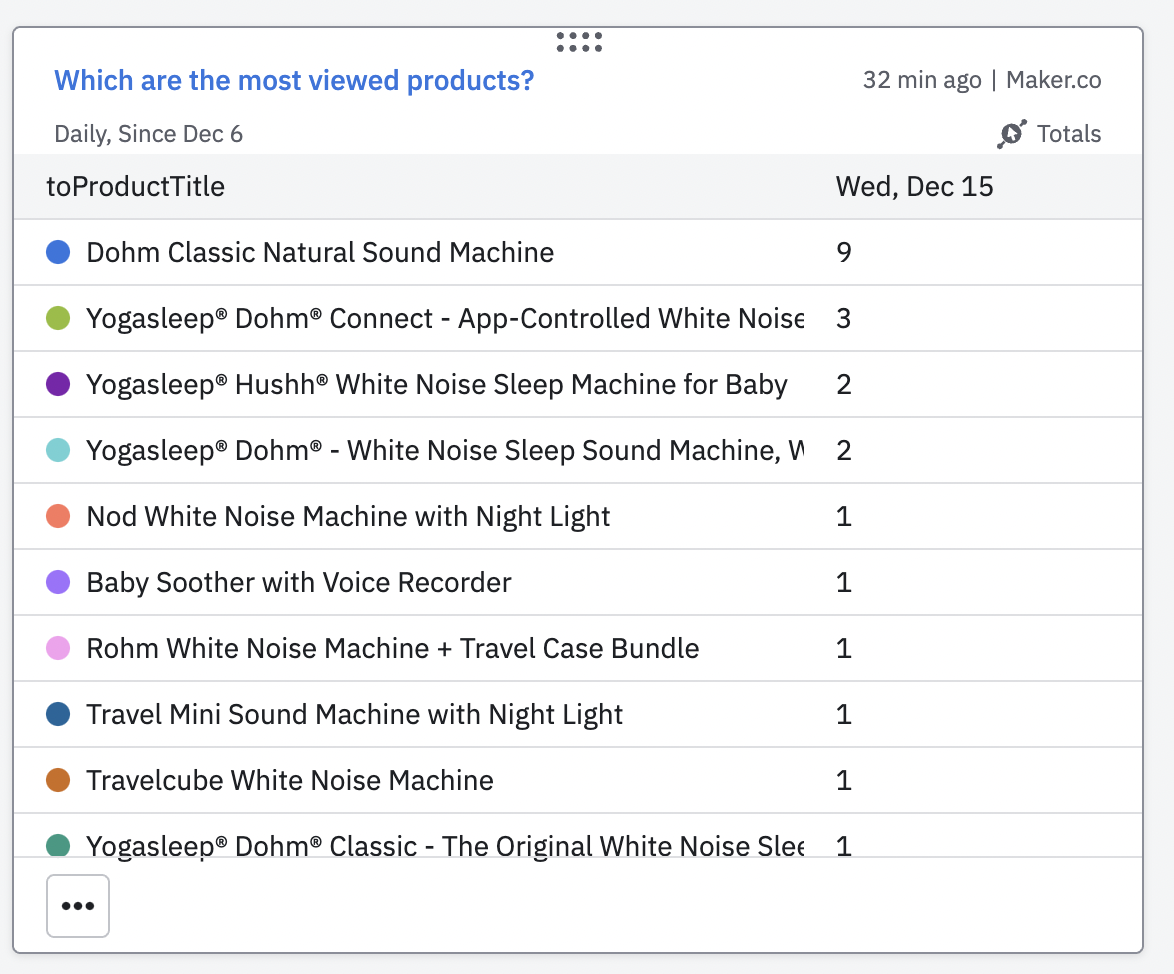
However, when I add this chart to a dashboard (screenshot below) it only shows the previous days total events and does not display the cumulative totals. This forces any viewer to have to click into each chart individually and scroll all the way down to the table to see the totals, defeating the entire purpose of a dashboard.
Is there any way to change this display?

Thank you,
Maitreya