How do I setup (a retention) chart that shows how much time a user spends in the product each day in minutes.
Hey Moritz ,I didn’t quite understand the “retention chart” part of your question, but looks like you came across the right chart to measure the time spend by a user in your product i.e the User Sessions chart.
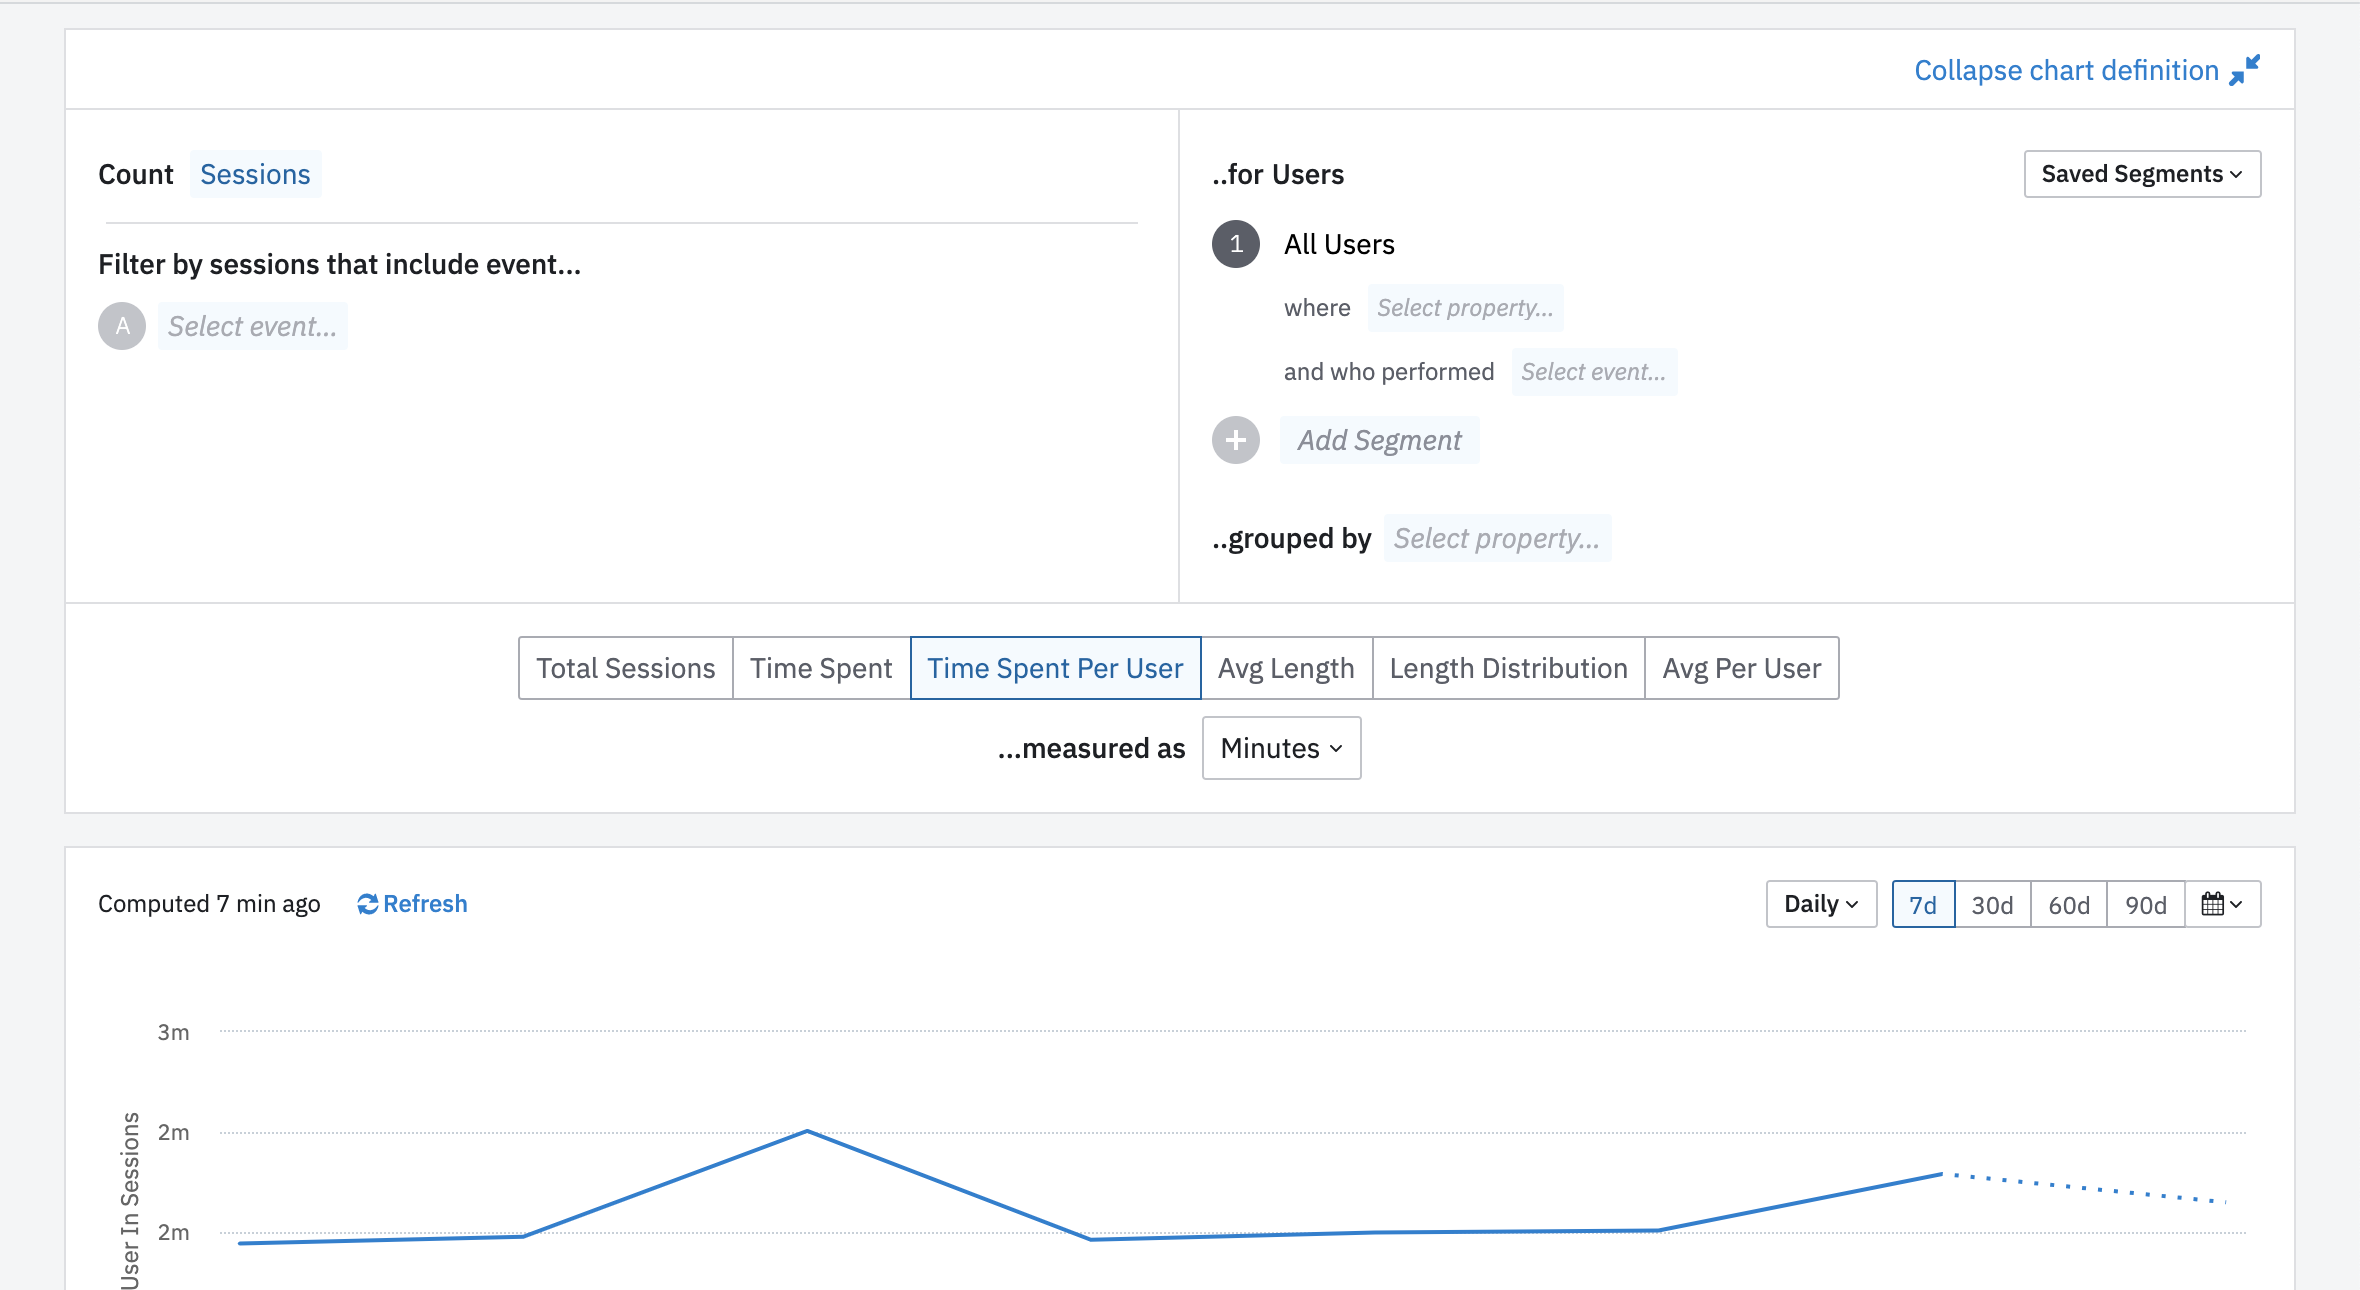
As per the doc, the Time Spent per User is the average amount of time spent in sessions per interval which is calculated by taking the sum of all session lengths within the interval, and dividing by the total number of active users in the interval. The session length for a user_id is calculated as the difference between the session_id set by your app during the start of a session and the timestamp of the last event before that particular session ends.
W.r.t. your data in Google Analytics, there are bound to be differences in the results. One of the common reasons is the way the session timeout window is defined in both of your instrumentation approaches. Here is a good resource to understand this. I would also point out to this post for further reference.
Hope this helps!
Ok I found this article which explain is pretty well:
Although I’m not sure how this is computed. Is it counting active time when there is a continuous stream of events Fired associated with one user ID?Our results seems way lower of what we had measured before on Google Analytics. Any idea what could be the reason?
I’m also not sure if this is measuring time per session on per day. The former would make more sense to me given the low results.
We implemented first party tracking using the basic JS SDK on the browser and pointing the payload to our servers like this: amplitude.init(AMPLITUDE_API_KEY, { serverUrl: serverUrl, autocapture: { attribution: { excludeReferrers: [/domain1\.com$/, /domain2\.com$/], }, formInteractions: false, fileDownloads: false, }, });…
My Android app is primarily a background app. Does Amplitude track events for such an app? Please let me know.
here is the referance graph: https://app.amplitude.com/analytics/demo/chart/new/363tk5og In this graph, retention is currently being calculated based on the next day, but I want to analyze it based on the previous day instead. Example: For July 27, we should compare retention against July 26, not July 28. * So for 1-day…
Hi everybody! I need your help with a client request: my client is used to analyze landing pages performance with the standard report from GA4 and I need to create something similar in Amplitude. What I already have: * session entries grouped by page URL * purchase event calculated as session totals grouped by page URL and…
Good day! I am new to Amplitude and still learning. Our organization’s current objective is to track specific webpages that have high exits/drop-offs so we think that the Funnel Chart is the best tool to use for it. However, you see our website uses 2 different domains in completing the buying journey of visitors (from…