Solved

See the cumulative % of my MAU that performed an activity over time

  • 16 August 2023
  • 3 replies
  • 83 views


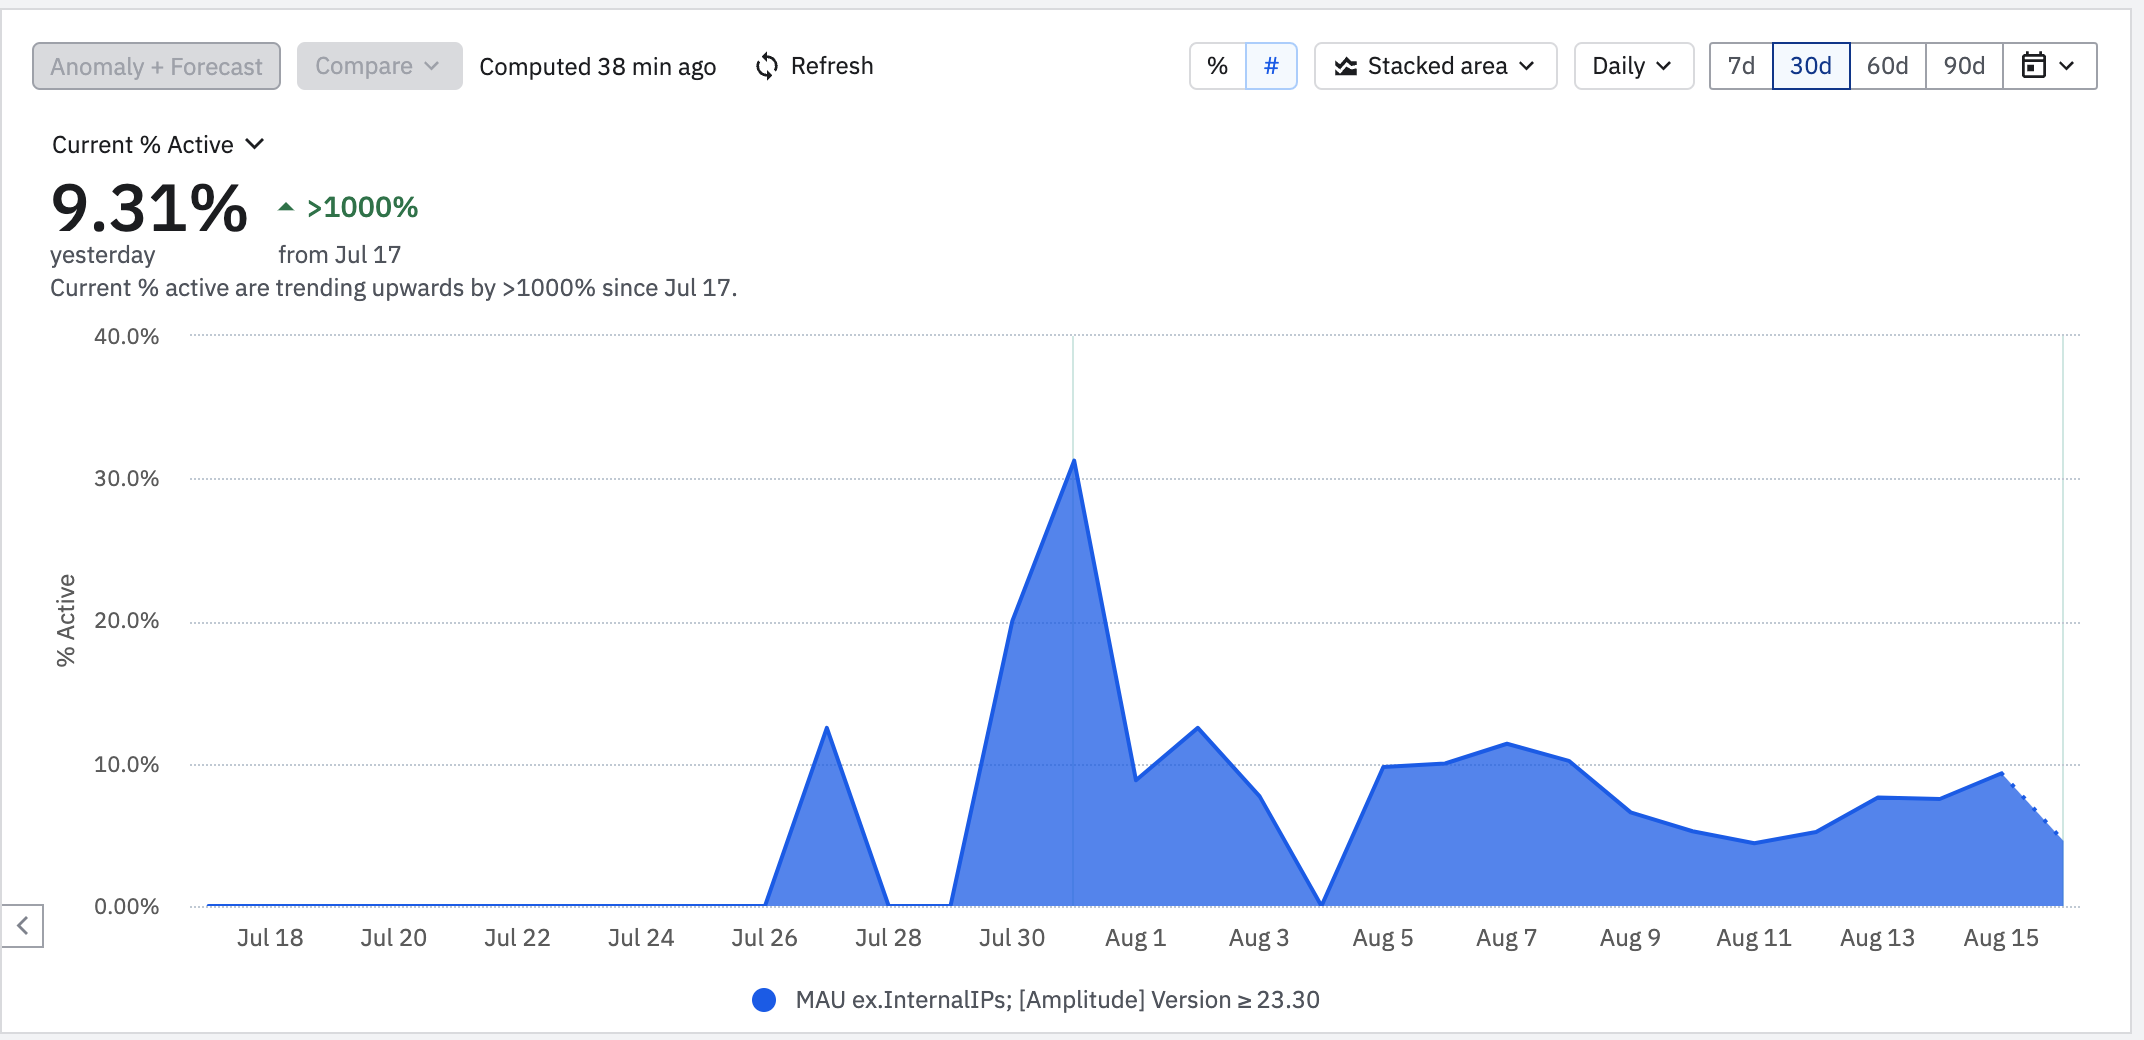
I’m using the segmentation chart and the % Active to see how frequently MAU are interacting with a new feature. I want to see this on a cumulative basis though, more like, what % of MAU have completed this event through X date. Not sure how to do this. 

If I change the chart type from Stacked area to Bar chart, I think that shows the total cumulative % that have completed it (it’s just a single bar) but I would like to see how that changes over time. 

icon

Best answer by Saish Redkar 30 August 2023, 15:11

View original

3 replies

Userlevel 7
Badge +10

Hi @Taj Sangha 

You can use the CUMSUM custom formula on the active % as seen in this demo chart - https://app.amplitude.com/analytics/demo/chart/new/n0c6w2hw


Hope this helps.

Thanks @Saish Redkar that’s very helpful. In my case, I can’t use the Amplitude definition of “Active” yet because the taxonomy isn’t clean so Since CUMSUM(ACTIVE, A) is not quite right.

I’ve defined a custom event that tracks what I think the real definition of active should be called “Engagement Event”. In my case, Engagement Event is a subset of all Active events -- i.e. all members who have performed it are Active but not all Active members have performed it. 


In that case, if I do a filter in the segment like this, do you think I am capturing what I’m trying to do correctly?

 For me a MAU is this “Engagement Event” >= 1 in the last 30days, not the amplitude definition of active.


Userlevel 7
Badge +10

Active % here means that  - of all the active users during that time range, how many performed your engagement event. You can either do it that way or choose your custom event as event A itself in the formula.

Reply