The colours on my bar charts are totally out of sync with my charts
I seem to have a disconnect between my charts and bar colours, and it’s breaking my head!
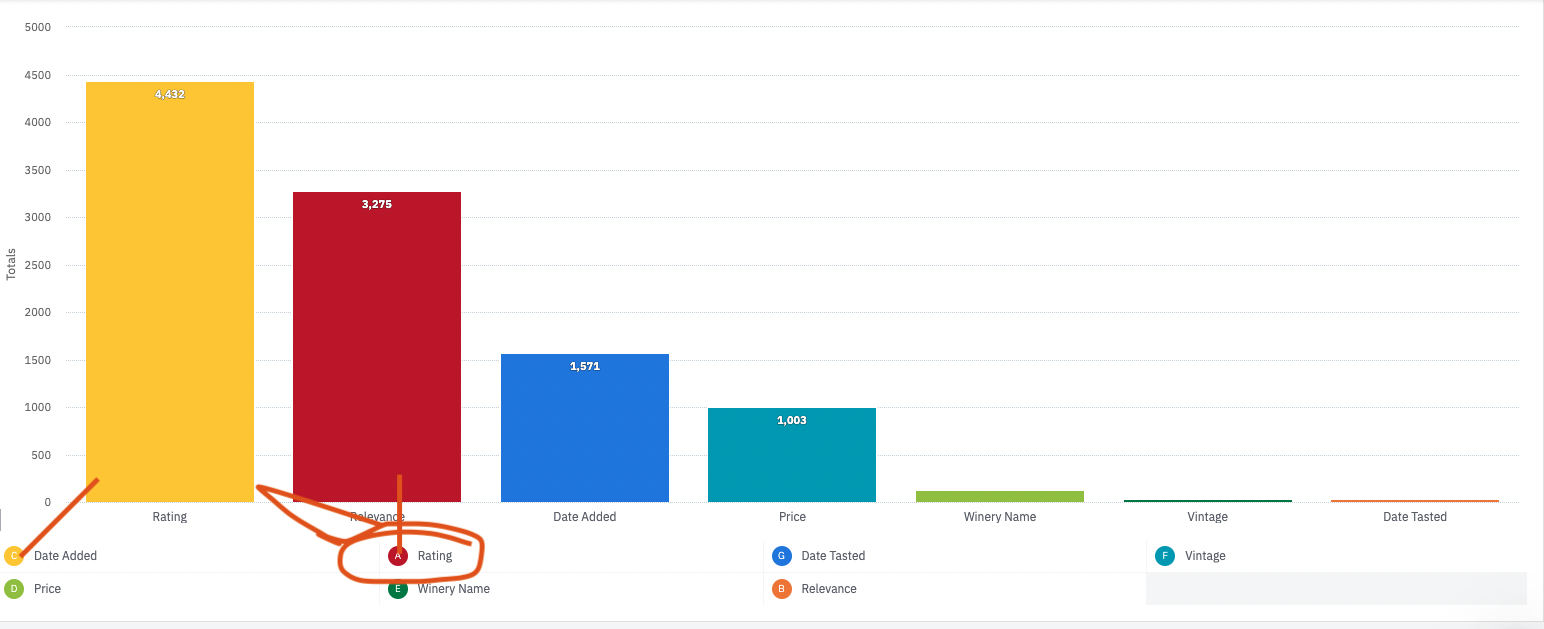
My bar colours are not matching the legend colours down below.
Hey unodewaal Unfortunately, this behavior is quite common when trying to manage labels and colors in Amplitude charts. It can get quite unnerving sometimes and I have been in the same position.
Hopefully Product Team is keeping their 👀 on the chart colors issue which has been there for a long time now.
I ended up recreating the graphs from scratch. It seems as if messing with the labels and changing graphs in my filters messed it all up.
Thanks for the context Saish Redkar and for continuing to share product ideas with the team! 😃
Hi, When I add a chart (widget) to my dashboard, and then go to the content and modify the chart (I user another type for exemple) and save, my dashboard doesn't reflect the latest modification. Would you by any chance know why ? Thank you
Hi, I am doing a simple analysis : number of views for each pages of my website. So I use Segmentation but I always end up with a chart AND the table below. I want to display only the table (easier to read). Is it possible and how ? Thank you
We implemented first party tracking using the basic JS SDK on the browser and pointing the payload to our servers like this: amplitude.init(AMPLITUDE_API_KEY, { serverUrl: serverUrl, autocapture: { attribution: { excludeReferrers: [/domain1\.com$/, /domain2\.com$/], }, formInteractions: false, fileDownloads: false, }, });…
My Android app is primarily a background app. Does Amplitude track events for such an app? Please let me know.
here is the referance graph: https://app.amplitude.com/analytics/demo/chart/new/363tk5og In this graph, retention is currently being calculated based on the next day, but I want to analyze it based on the previous day instead. Example: For July 27, we should compare retention against July 26, not July 28. * So for 1-day…