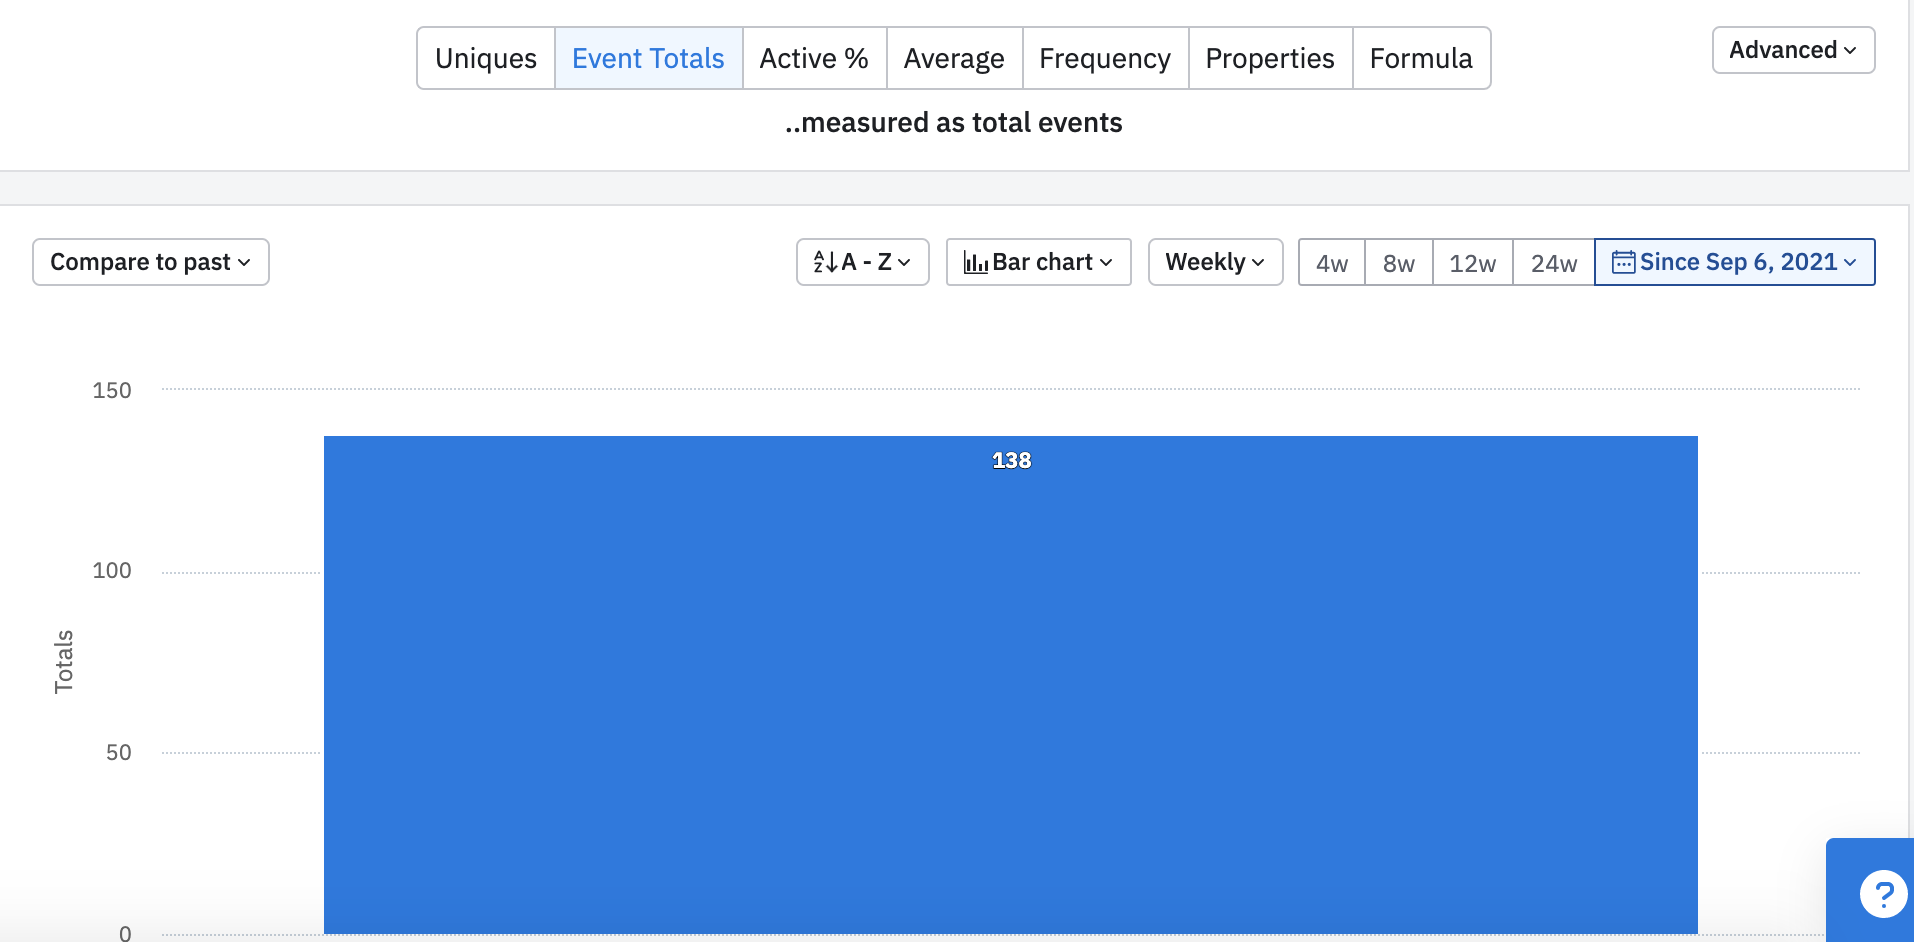
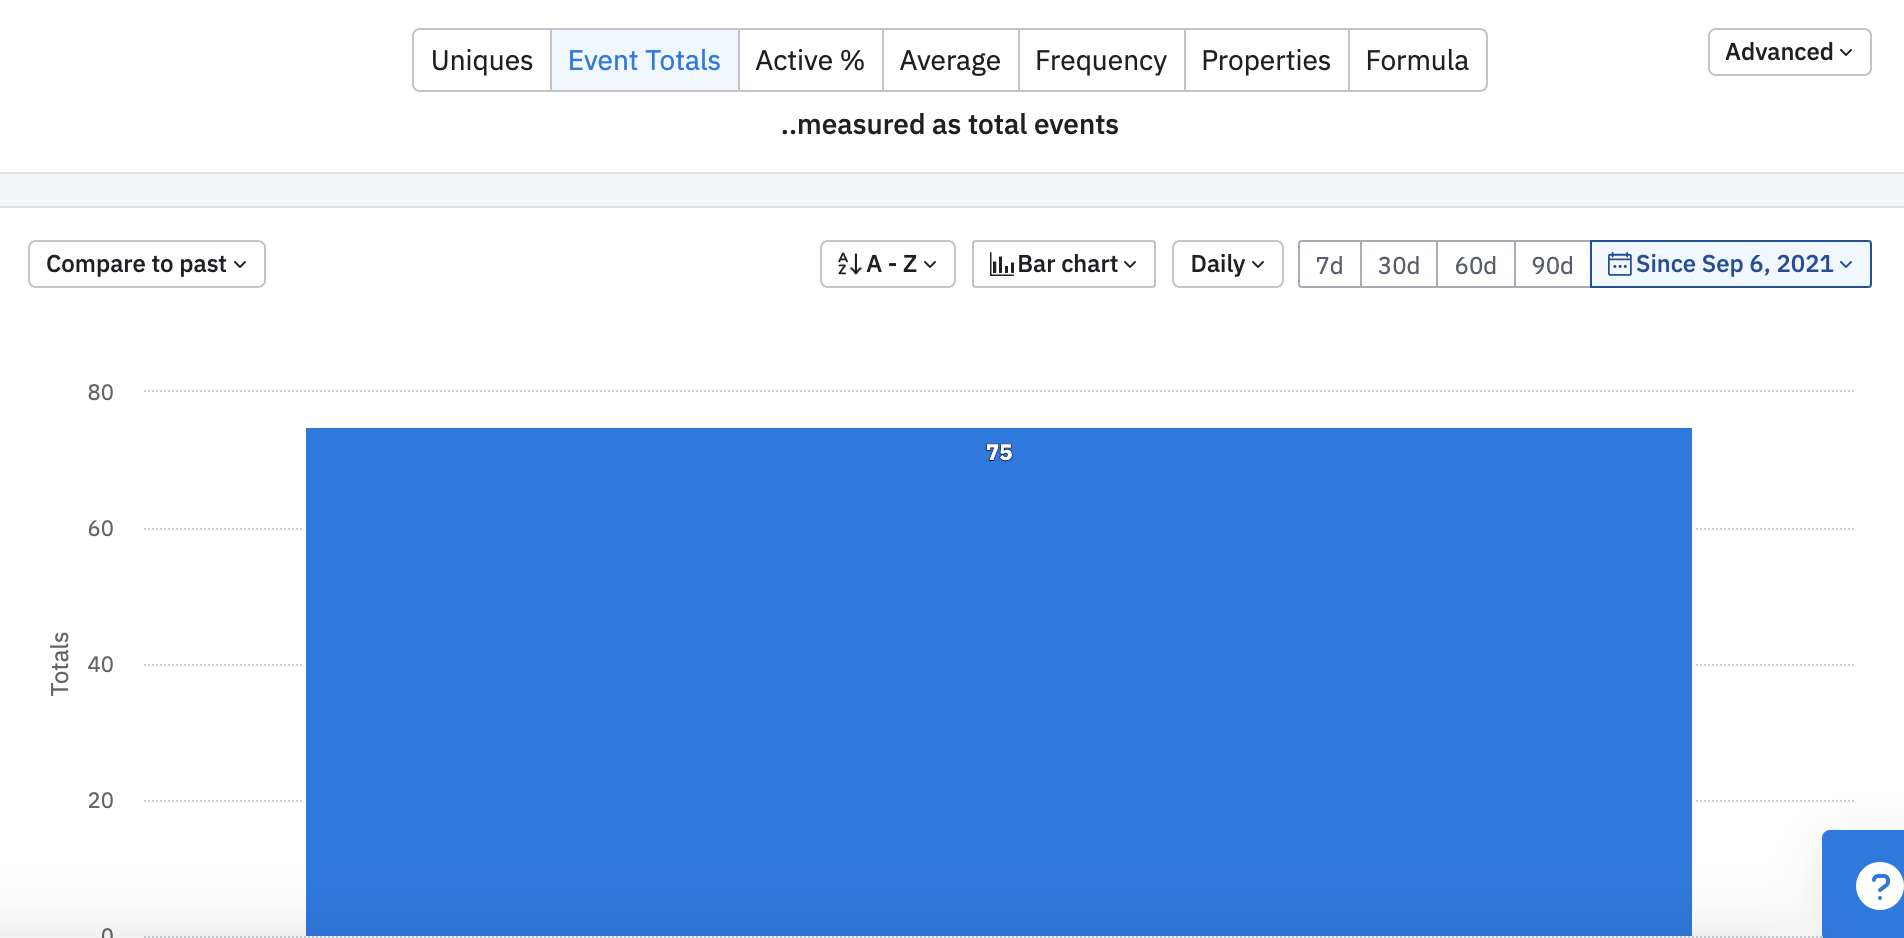
I’ve created a stacked bar chart that displays the event total for a particular event. When I choose a set date range (since September 6th) and count up the total events in the graph I get a different number when it’s set at daily vs. set as weekly. Counting up the bars - daily totals 73, weekly totals 138. Why is there a disparity? Surely the total number of events in the time period should be the same?