Currently, dual Y axis is only supported for line visualizations, but I’d like to create a bar chart, with a second metric plotted over it as a line visualization (“combo chart”, very standard chart type in other data viz platforms).
My specific use case is that we want to track grouped conversion rates in a bar chart, and then see total volume as well for added context (ex: wow conversion rate in this category is super low but it’s only 10 users, so not worth looking into). Right now we have to pull two charts side-by-side in a notebook.
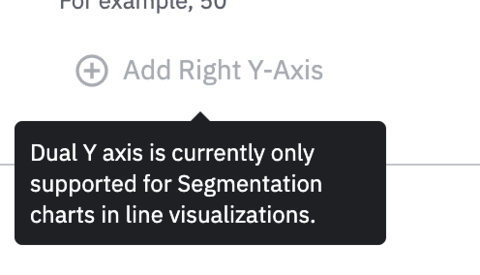 Error I get when trying to add a Right y-axis to a bar chart
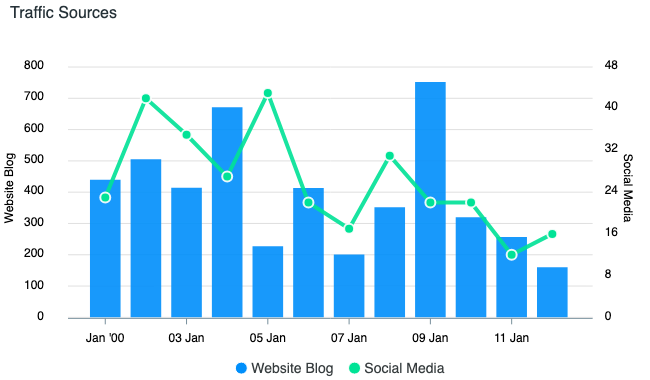 Example of requested chart type
