In this session, we answer these key question:
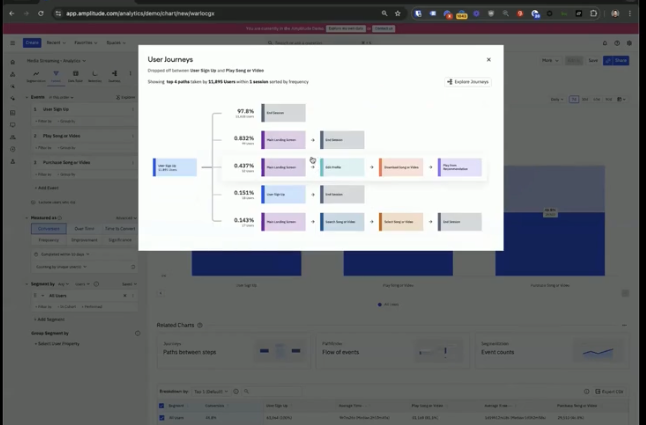
- How can you map the user journey to pinpoint conversion and drop-off points?
- Which funnels should you focus on to improve user activation?
- Rocking your world when you start with a Journeys chart (and not Funnel!)
- What's the base line conversion for our core funnel(s)?
- How to identify and resolve friction points that hinder user conversions?
- How to measure "time to convert" to optimize onboarding and activation strategies?
Get the full recording here:
Kill your assumptions. Start with Journeys to discover what user journeys look like in the wild.
Historical Count Feature
-
The 'historical count' feature in Amplitude tracks how many times a user has performed an action. (e.g. historical count = 1 shows the first time a user performed an action, historical count = 3 shows the third time a user performed an action, etc).
- This feature is useful for analyzing user behavior patterns, such as how many times a user engages with content before making a purchase.
- One interesting use case is building a cohort of users who used a feature x# times and are nearing a paywall. Could be an interesting cohort to dig into in monetization plays.
Building Funnels
 Going from the cohort of users that didn’t convert and viewing which journeys they took instead.
- The use of conversion drivers to identify actions correlated with successful funnel completion is demonstrated.
Retention Analysis
Compass Feature Introduction
Cross-Project Data Analysis
- Is it possible to have data from different Amplitude projects at the in the funnel chart or mobile app is tracked on a different project?