Solved

Average Time Between Events

  • 5 October 2022
  • 5 replies
  • 2301 views

Badge

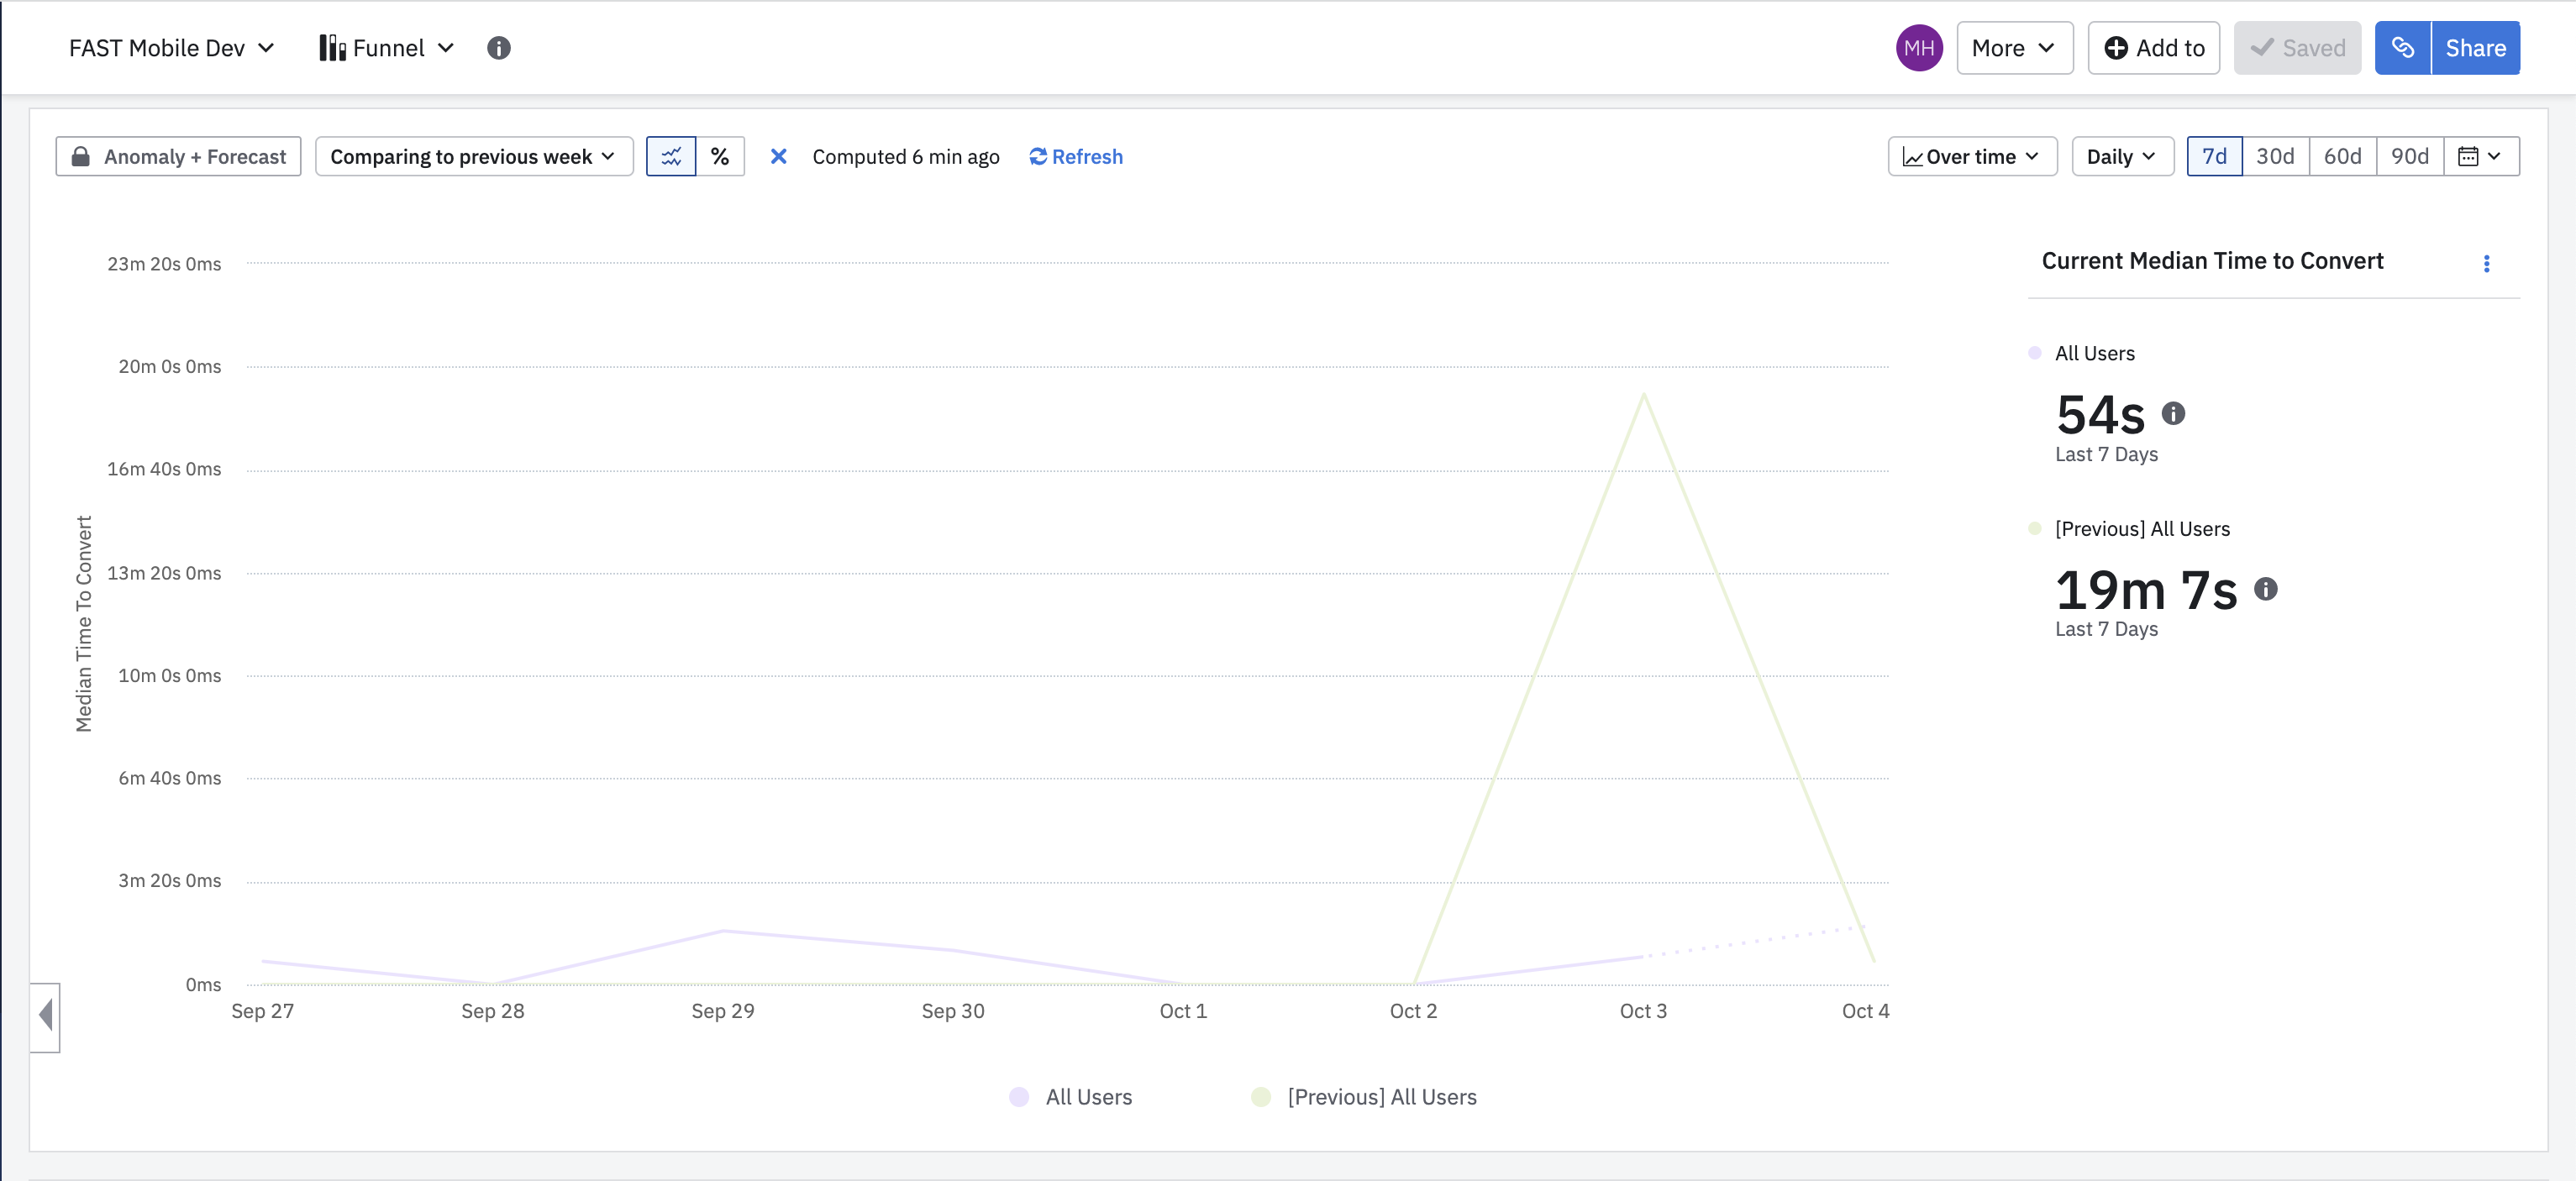
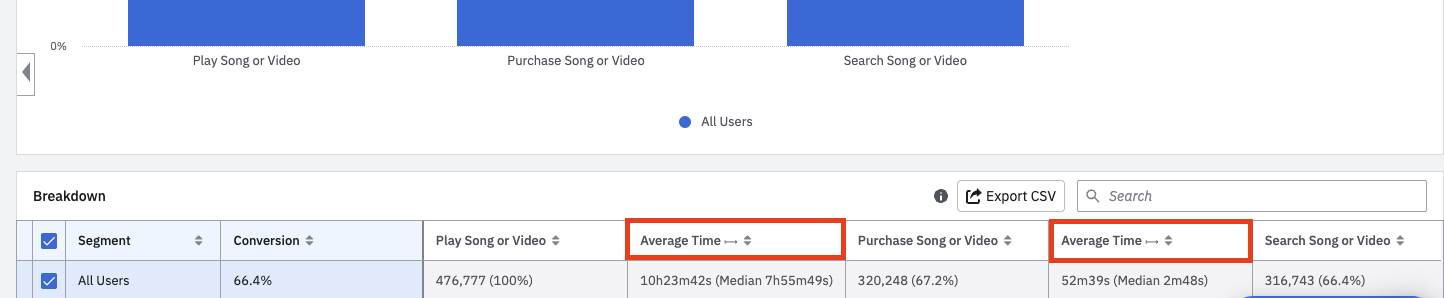
What I’m currently needing is a way to track the average amount of time it takes to complete the conversion from one event to another. I’m currently really close to achieving this, as we’re sending the events we’re needing to measure the time between and have a Funnel graph that shows “Current Median Time to Convert”, but I’m only interested in the average (or mean) time to convert, not the median. Is it possible to have this same type of graph or something similar but with average time to convert on the y-axis instead of median time? So far I haven’t been able to find a way to achieve this. I reached out to a member of Amplitude support a while ago and his only response to this question was that he did not currently know of a solution… 


icon

Best answer by munroek-amp 6 October 2022, 00:48

View original

5 replies

Userlevel 2
Badge +3

Hello @michaelhandkins! Currently, we do not have an option to directly display the mean within the chart. What we do have towards the bottom of the chart, is our breakdown table that contains the average time between each of the steps: 

If displaying the mean within the graph is still the goal rather than just displaying the average times in the breakdown table, I can certainly submit a feature request for that feature. 

I will be looking forward to your response!

Badge

@munroek-amp Yes, we would really like to be able to display the mean within the graph. That would be great if you could submit a feature request for that! Thanks 🙏

Badge

@munroek-amp In the meantime, would it make a difference if we were to calculate the conversion time on our end and send that to Amplitude as a property of an event? Let’s just say we have an event called `task_completed` with a property called `time_to_complete` which holds the conversion time we calculate. Would there be a way to make a graph in Amplitude that for each day shows the average (mean) of all `time_to_complete` property values of all `task_completed` events for the day?

Userlevel 6
Badge +9

Hi @michaelhandkins Sorry this slipped through the cracks. Were you able to make progress? Here’s where you can learn more about submitting product feedback. 


Hi @munroek-amp @Amplitude Admin  I can see your reply above that back in the day you didn’t have the feature to display the time a user spent between events in a dashboard. Is this feature available now in some way? 

I can create a Funnel and I can see the average time of the session between events in the Data Table below the chart once I am in the chart view. However, what we need is information to be visible in one of our dashboards.

If this is not a supported feature, could we request this?

Reply