Solved

Stickiness Graph: How can I interpret the day 1 percentage, if I set the events to any active event?

  • 27 October 2022
  • 1 reply
  • 121 views

Userlevel 1
Badge

Hey everyone,

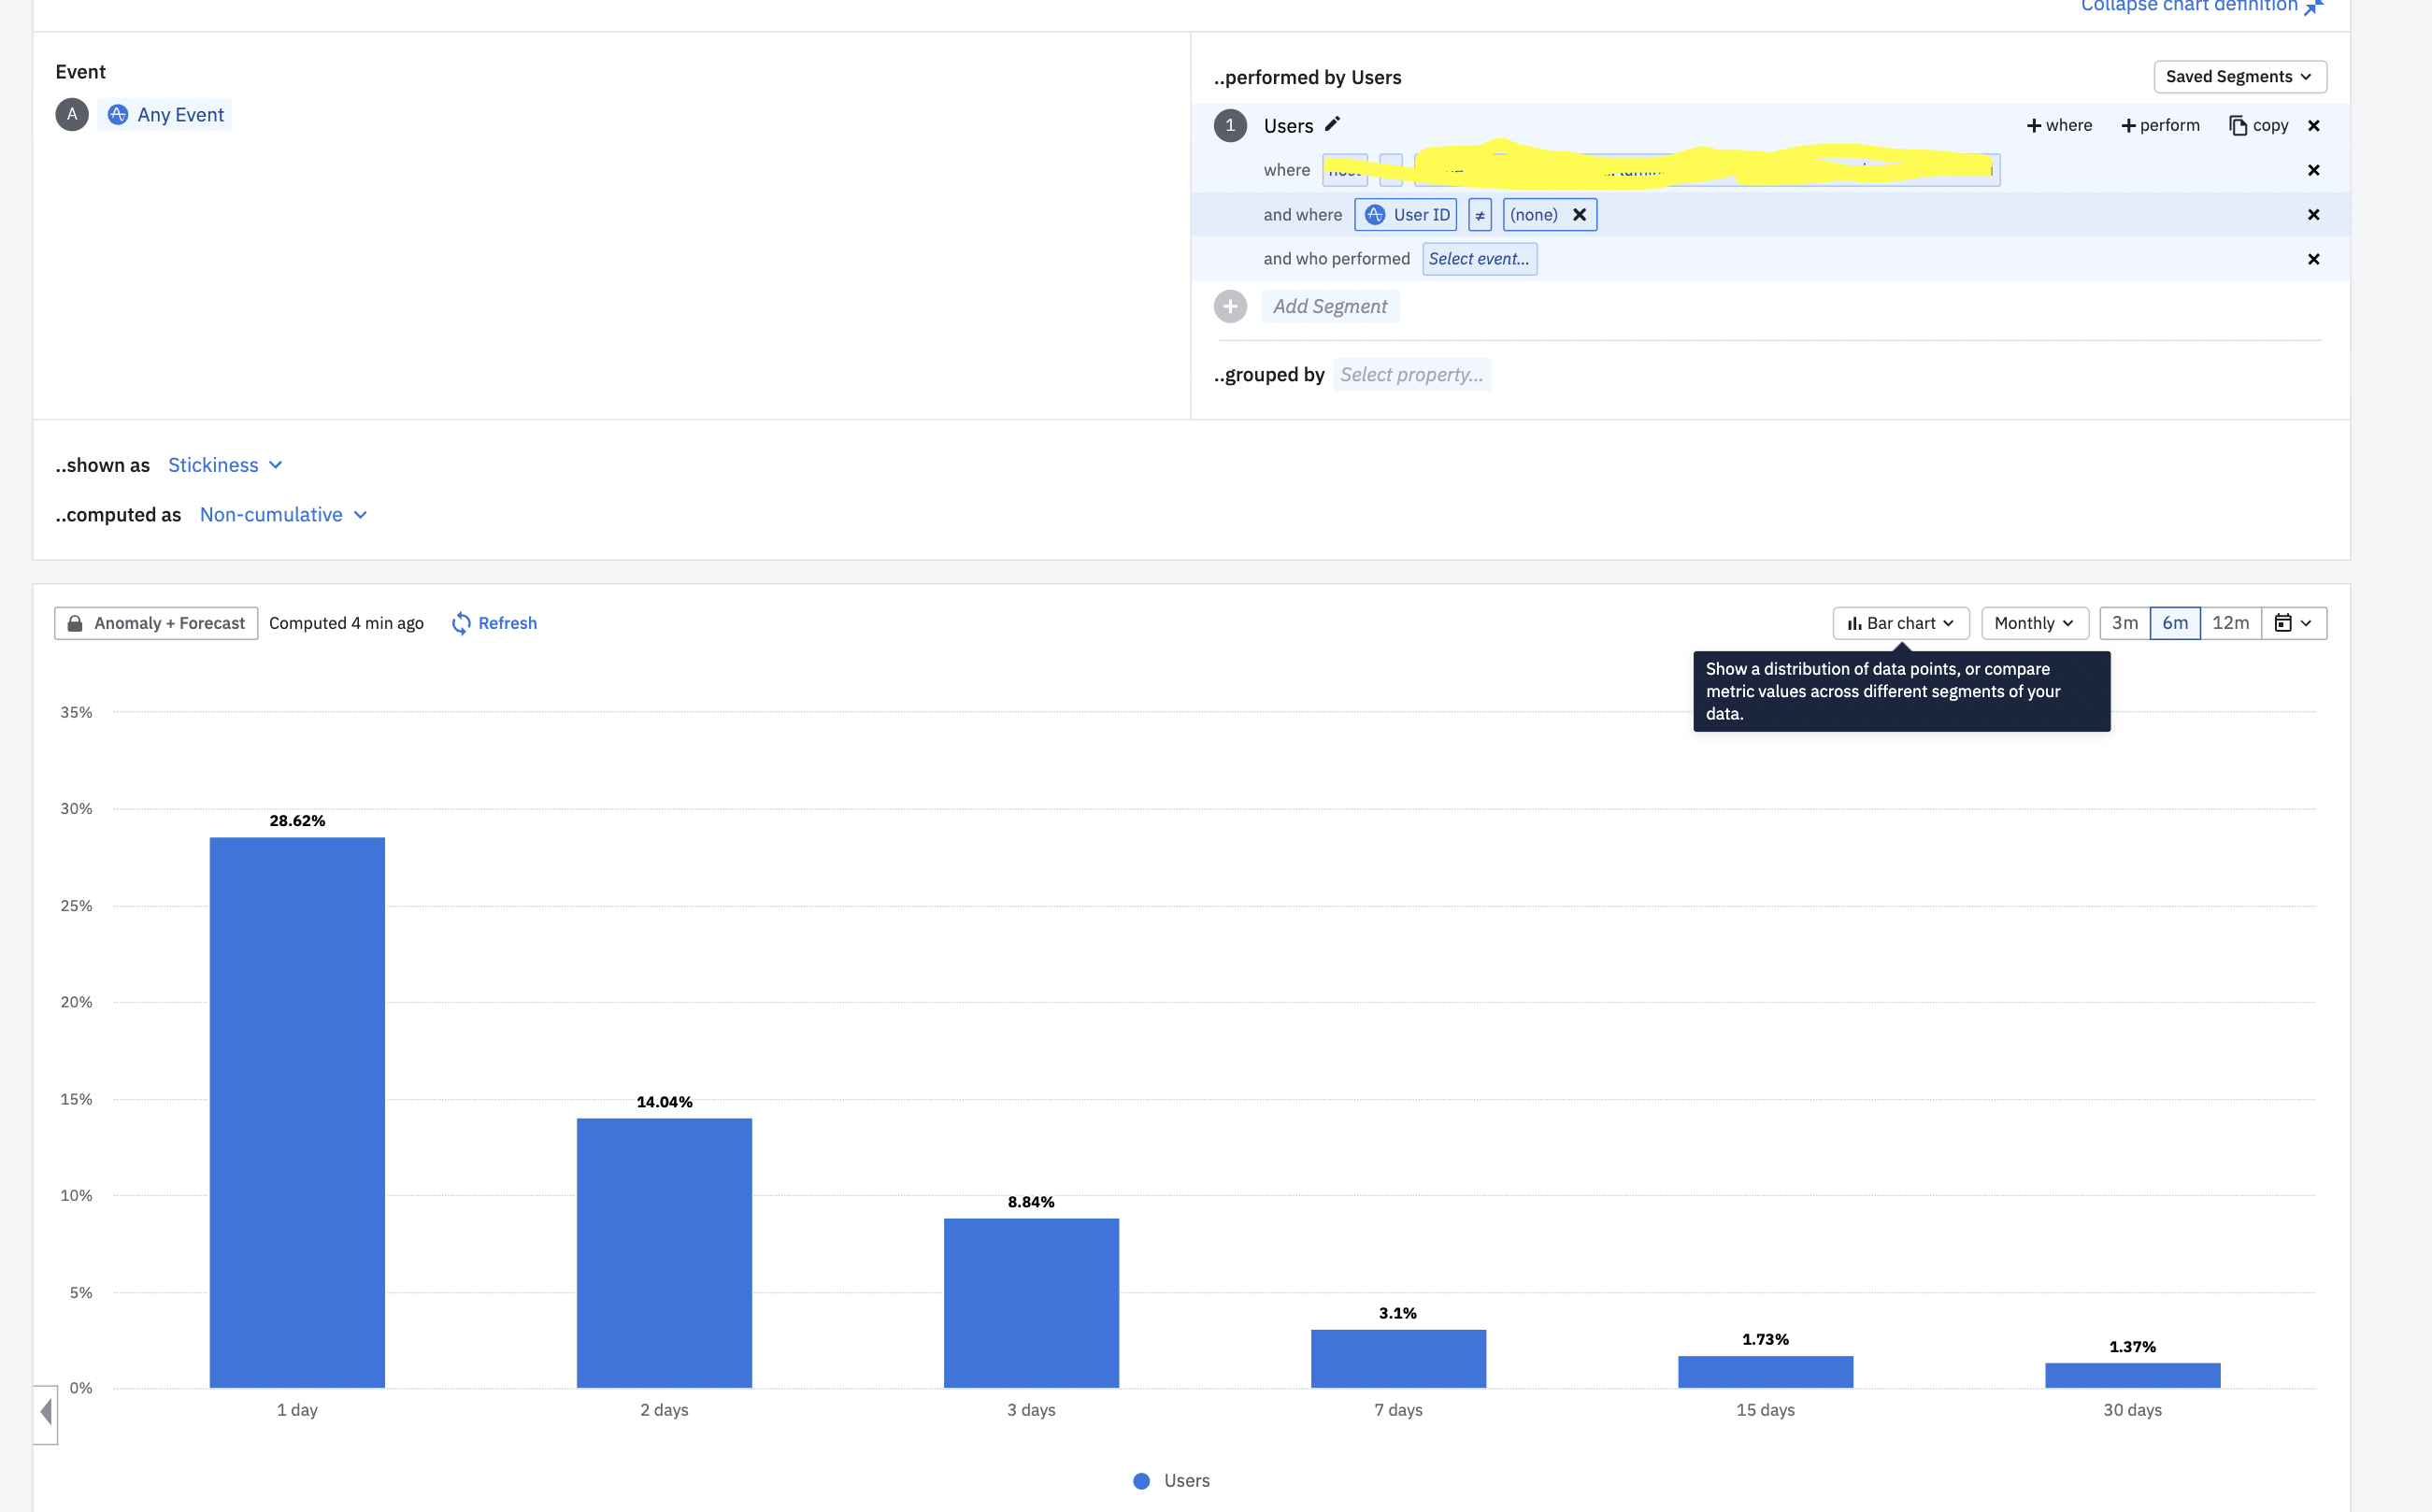
I created a stickiness graph and set the event = any event. 
My two questions are:

  1. Why can I only see 6 days in the bar chart view?
  2. What learning can I draw when the event is set to any event and my 1 day bucket is at 29%? Does this mean my users perform a lot of events which I am not tracking yet?

As always looking forward to your replies :) 


icon

Best answer by timothy-permutable 11 November 2022, 08:57

View original

1 reply

Badge +10

Hi! Can I ask what question you are trying to answer about your users? Then maybe I can better guide your setup of the stickiness chart.

In short, with the current settings you have, the chart is saying that 29% of the users who fire an event only fire an event on a single day.


In general I would recommend that you use “any active event” with the stickiness chart. You might have inactive events - I think it’s unlikely you want to include those in a stickiness analysis.

Reply