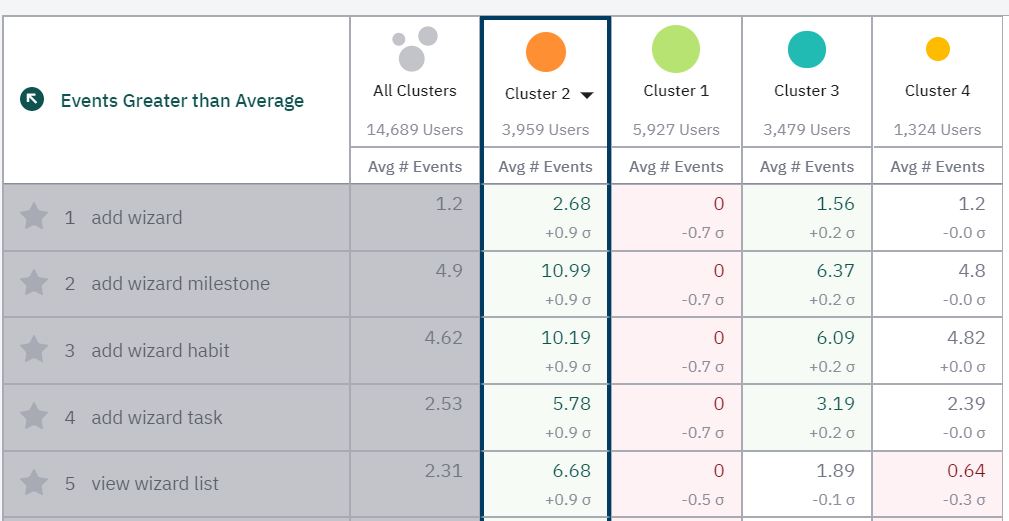
Hi, I would like to know “Personas Chart” > top events and lower events
- the average # of events: for example, cluster 2 users do event “add wizard” with the average number of 2.68, then it means that 3959users *2.68 =10,610 “Add wizard” event has been fired in total
- what does σ mean? the standard deviation?? σ how is it calculated? It looks like the events are listed in the order of the bigger the σ is, the upper in the list the event is located. however, if this is standard deviation, if it’s bigger, it means that the difference from the mean is big, and that means there are some users who aren’t performing like the mean number of events. If so, I think the lesser the σis the more important that event is, because almost all the users are firing the event Also, if this is standard deviation, there’s no minus value for standard deviation, but for the event “Add wizard”, cluster 1 is showing minus value. I really don’t understand.