Solved

Is it possible to create a average time to convert per day chart?

  • 24 June 2021
  • 3 replies
  • 584 views

Badge

Hello everyone! Can somebody help me with this?


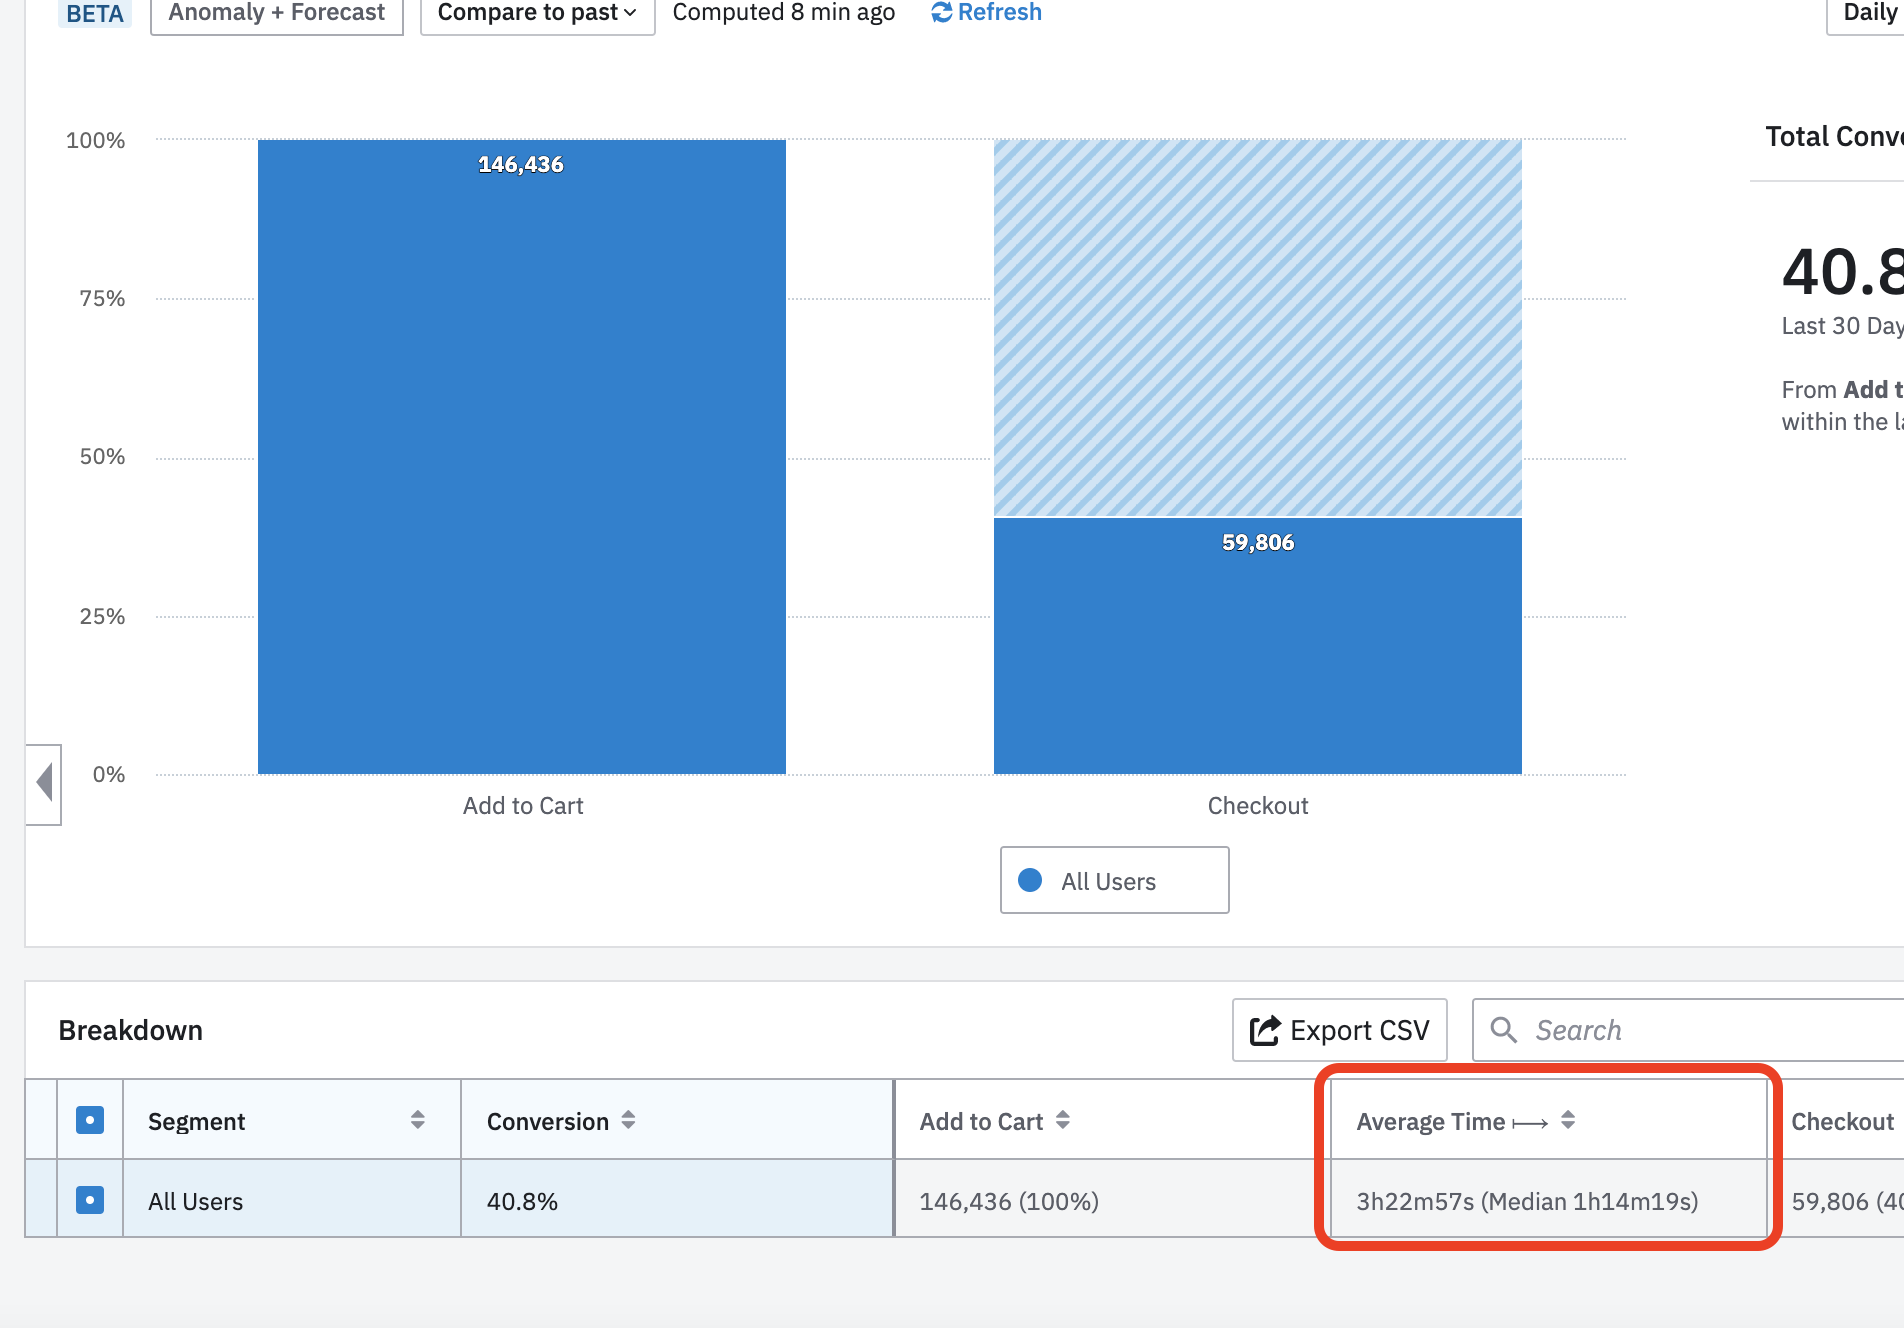
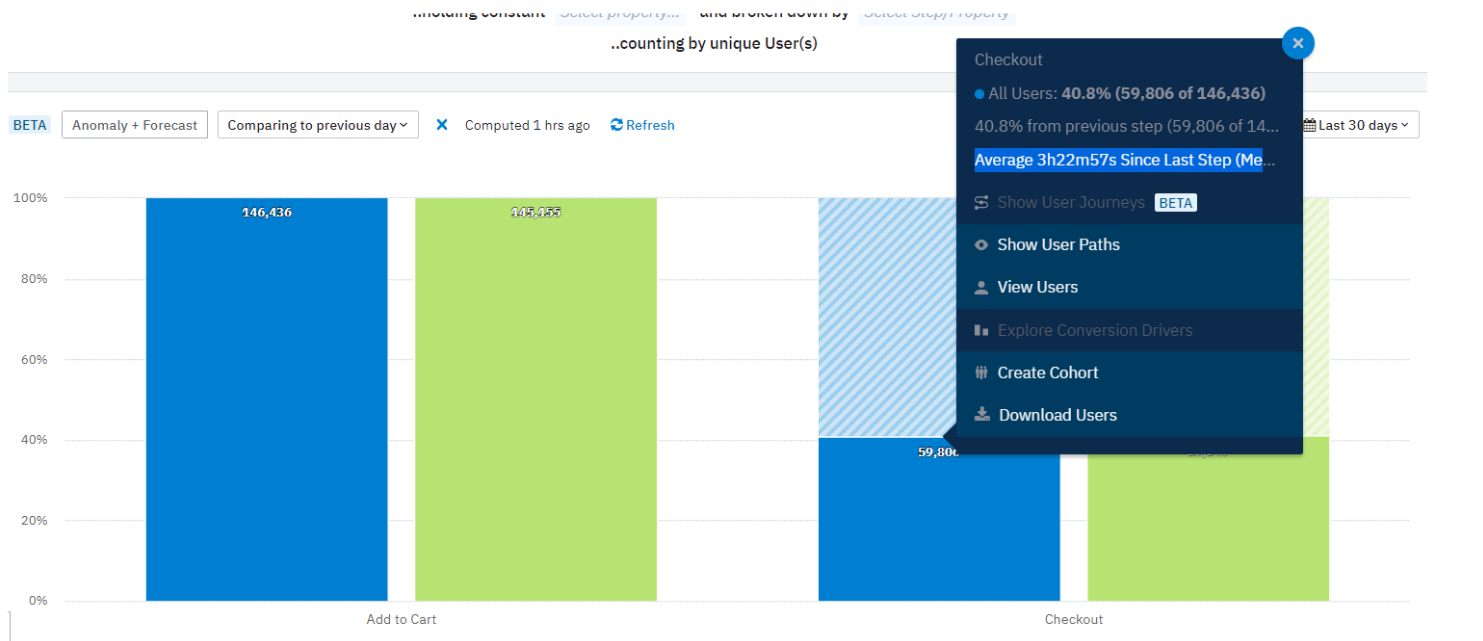
I want to measure if the average time to convert an action is going up or down depending on the updates we launch on the product, but I can’t seem to find a way to build a chart like this “Average time to convert per day”. Is it possible?

icon

Best answer by jarren.patao 25 June 2021, 18:29

View original

3 replies

Userlevel 4

Hi @melissaviana

Our Funnel Analysis chart has the ability to look at the average time to convert over the entire timeframe, but there isn’t necessarily the functionality to look at the average time to convert per day.

Would you be able to expand a bit here about your overall goal for this metric and why this would be relevant to your analysis? This will help me understand if there is a possible workaround within the product.

Otherwise, you’ll see in this chart here that you are able to look at the average time to convert over the entire timeframe that you’ve selected: https://analytics.amplitude.com/demo/chart/new/zfzjb2j

Hope this helps!

Badge

Hello @jarren.patao! Thanks for your response!

I'm trying to measure the average (or even median) time to convert of two actions completed within 30 days and holding a specific constant. This is a successful metric for the product and it is important because if we release a new feature and this metric is impacted, I need to be able to measure it daily to rollback if necessary.I know that Amplitude already has the data, because in this chart you showed as example, I can compare the average and the median with the day before, 7 days before or even a month, like this:

Today: Average 3h22m57s Since Last Step (Median 1h14m19s)
Yesterday: Average 3h26m20s Since Last Step (Median 1h14m37s)

So what I'm trying to do is put these results in a chart per day... do you have a workarround?  


Userlevel 7
Badge +10

Hey @melissaviana 
As Jarren mentioned, there isn’t a direct way to chart the average time to convert per day over the desired time. 

One potential workaround ( a long and complex one) I can think of is leveraging the Funnel Analysis endpoint of the Dashboard API. Using this, you can call the endpoint for your funnel time period and then try using dayAvgTransTimes series datapoint which gives you the average transition times by day between steps in milliseconds. Once you have the raw data points you can chart them in some external BI tool. 

Let me know if you are able to try out and get something useful from this approach. Hope this helps!


Reply