Solved

How to build a chart with adoption and retention?

  • 5 April 2023
  • 1 reply
  • 127 views

Badge

I want to build a chart with four steps

  1. Target population (can get done with segments)
  2. Adoption
  3. Retention
  4. Satisfaction

I have an adoption event, and the same event is the retention event. And I want to measure satisfaction by checking that no errors occured during that event. So it should be like

  1. Adopted: export_clicked
  2. Retained: expport_clicked
  3. Satisfied: export_clicked WHERE no_errors = true

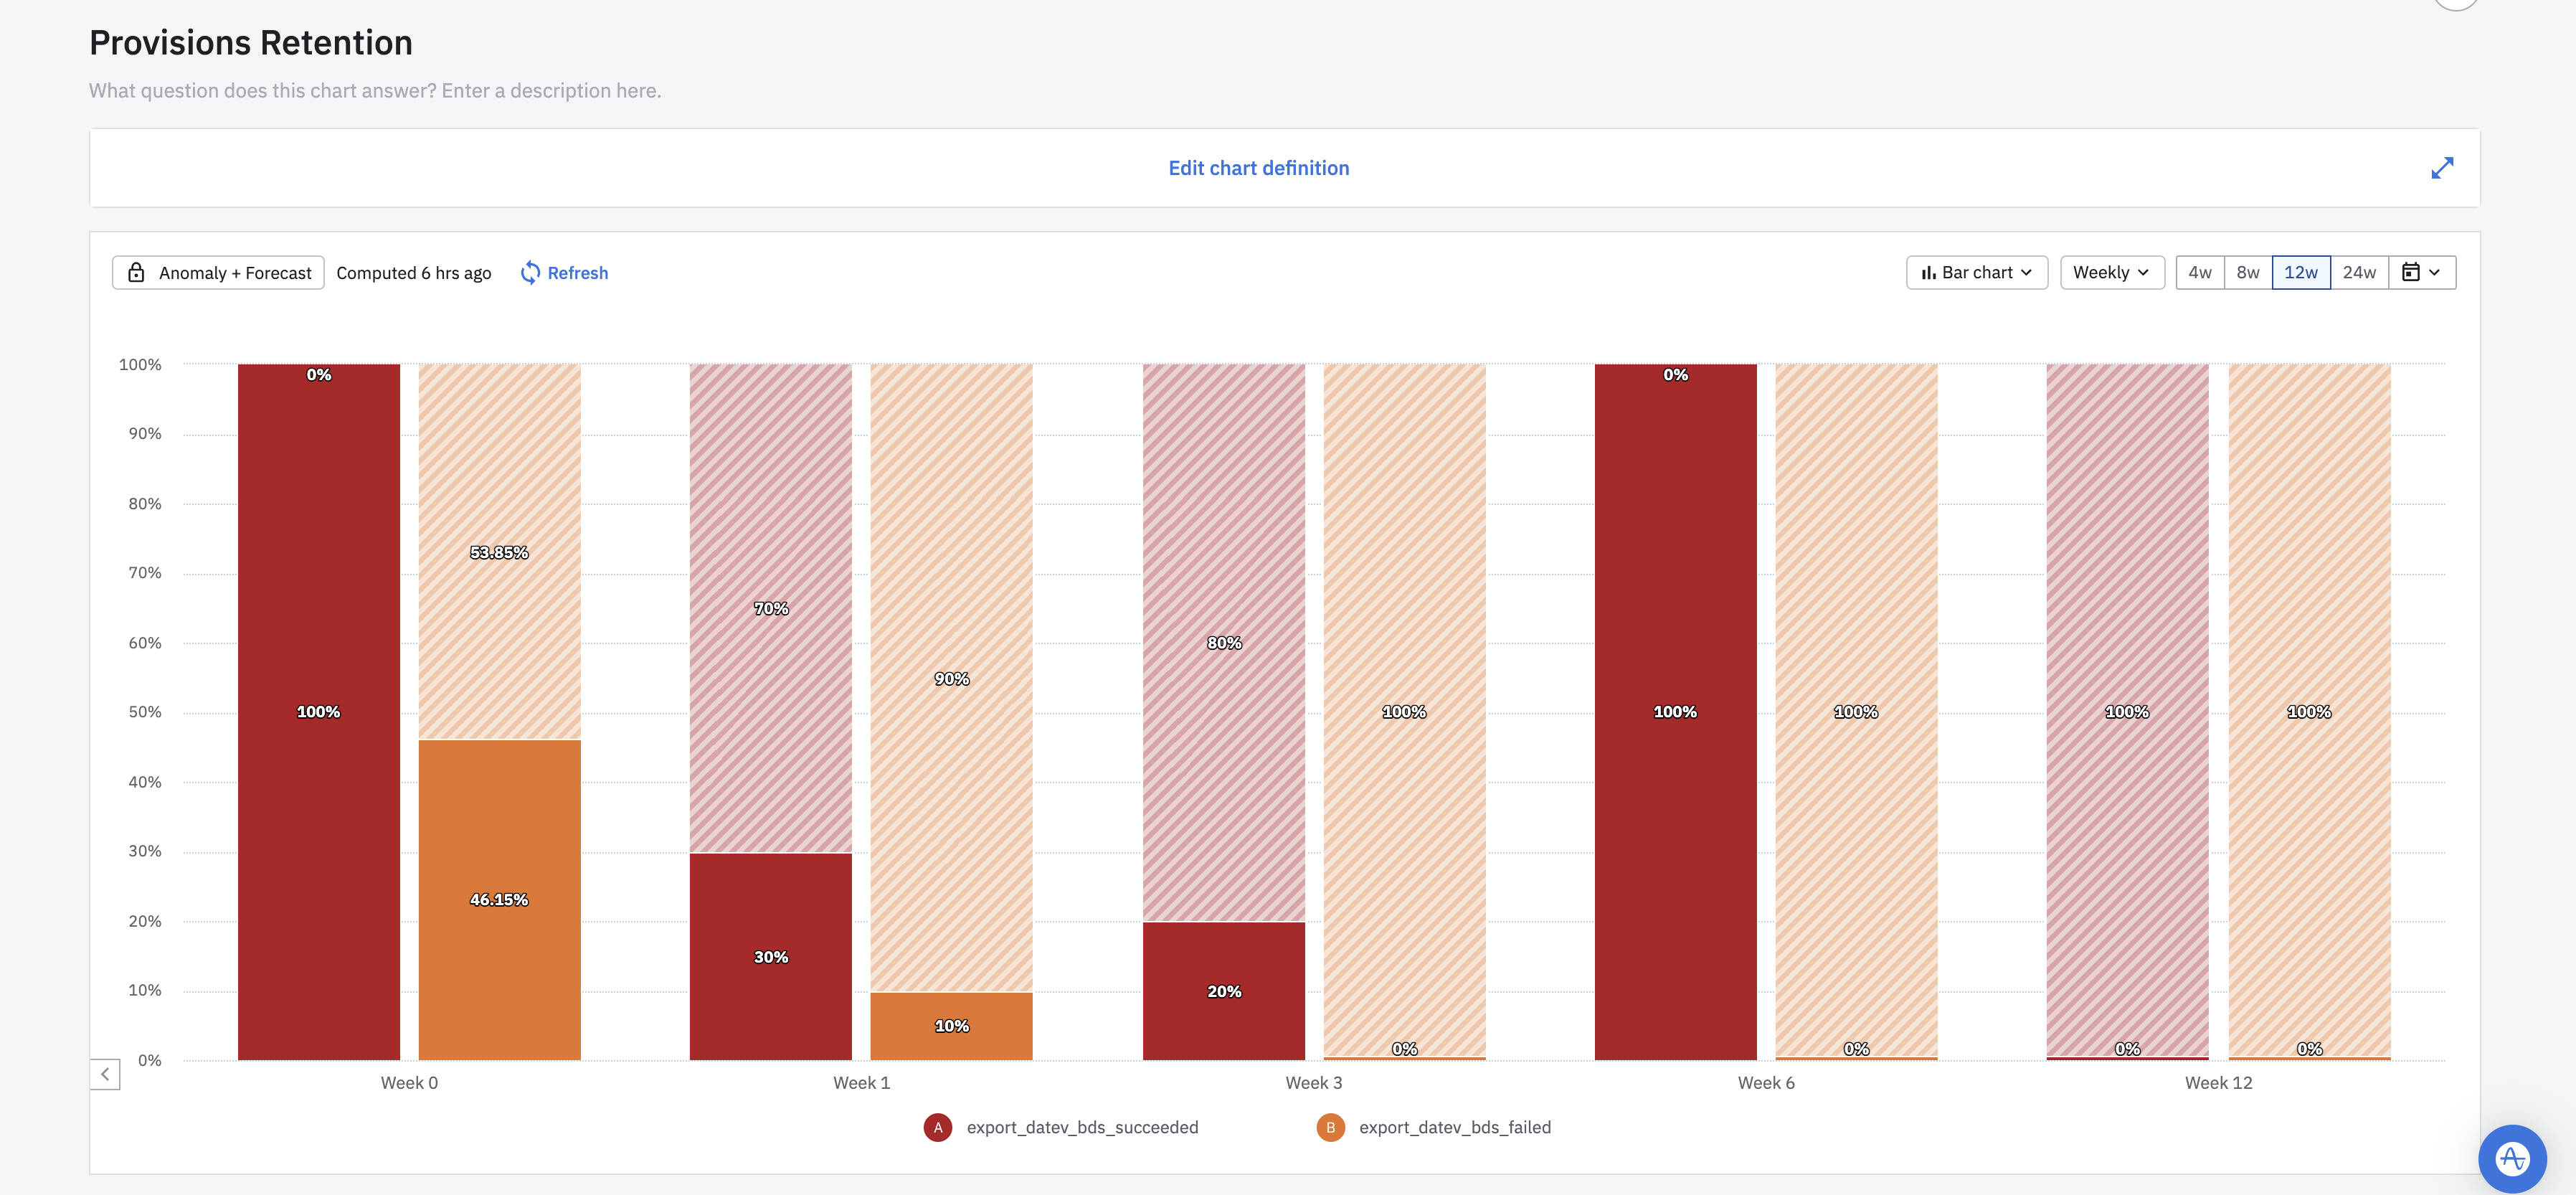
This is what I got, it’s not what I want. Any ideas how can I get it done? For example, the two events are measured seperated (succeeded and failed), but it should be one step. Am I maybe using the wrong chart?


icon

Best answer by tsegalla 6 April 2023, 17:18

View original

1 reply

Userlevel 3
Badge +5

Hi @lars, thanks for sharing your use case.  Maybe our Funnels chart would be helpful here:

  • Set up your segmentation with the user details you need.
  • Step 1: export_clicked
  • Step 2: export_clicked

You could also breakdown Step 2 by the ‘no_errors’ property.  Also, my thought process is that by someone converting to Step 2 within a certain conversion window/time period, your goal to understand “retention” is satisfied by those who perform Step 2 (aka the same event twice).

I hope this helps!


Reply