Hi, I have been looking through the Demo dashboard
and I was wondering
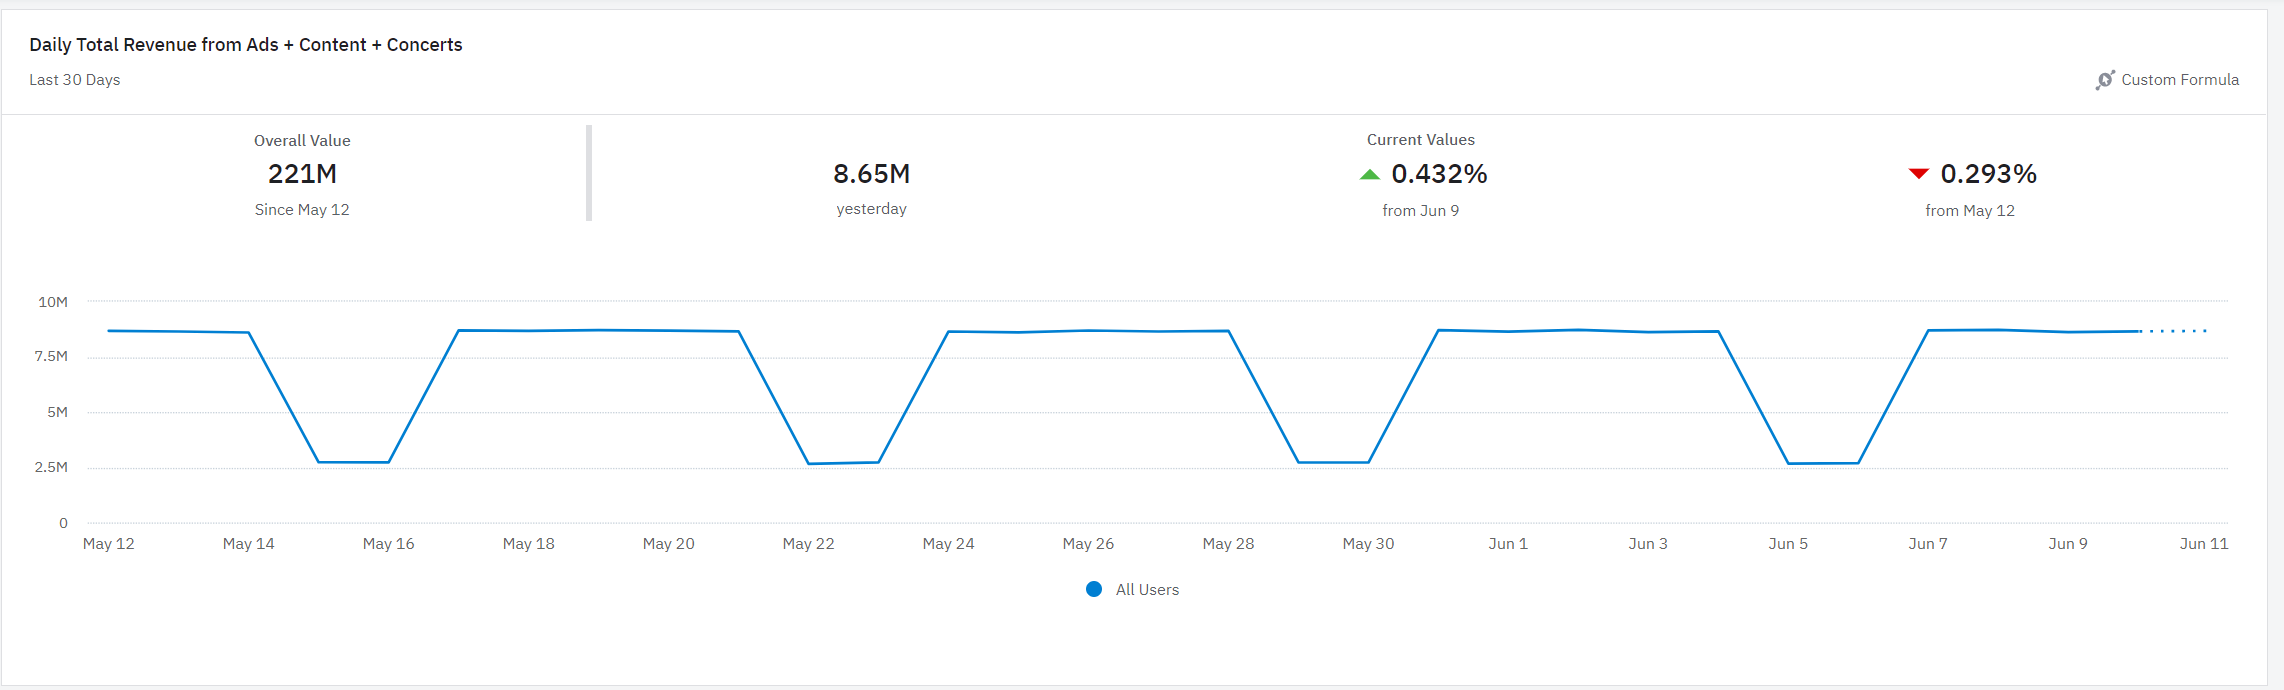
How can I create the number section above the graph?
oveall value, yester day, vs current values,vs from May12
this part.
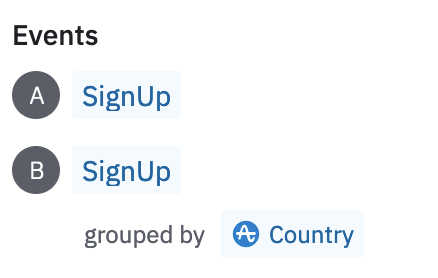
the chart format is custom formula, so I tried to copy and past the formula to the event segment
chart, but it didn’t work.
How can I create this type of, ‘showing the important number above the graph’ dash board?
thanks