Question

Histogram of active days in last 28 days

  • 6 June 2023
  • 4 replies
  • 191 views

Badge

Hey all, 


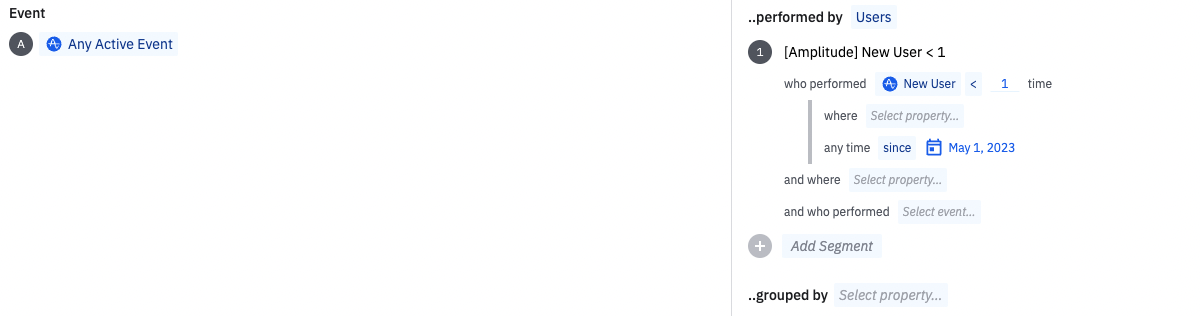
I am trying to create a histogram of active days for a particular event within the last 28 days for people users whom are at least 28 days old. 

I have seen a few similar histogram posts but nothing that groups users by active days. Any way you can help would be appreciated. 

Thanks


4 replies

Hi Simon - I think an option to capture this information would be to leverage a Stickiness chart looking at Any Active Event, users who performed New User < 1 time in the last month, and with a date range on the chart of the last 1 month.

Stickiness enables you to see how many unique days in the specific range users performed the action listed. Does this address what you’re looking for?


Badge

Hey Corey, I am not sure how to read this. With the resulting chart does the % number in “1 day” column show the amount of users who do this daily? and “2 days” column show the percentage of people who did it every other day?


Userlevel 7
Badge +10

Hi @Simon Hilton
Adding to Corey’s response, the non-cumulative stickiness definition might help in your use case

https://help.amplitude.com/hc/en-us/articles/360053681271#non-cumulative-stickiness

HI @Simon Hilton - Following up on Saish’s response, I think this article is helpful for outlining interpreting your Stickiness chart.

In general with the non-cumulative view, users in the 1 day bucket perform the event 1 day per week, users in the 2 day bucket perform the event 2 days per week, etc. Using the cumulative view would show users who perform the event AT LEAST 1 day per week, at least 2 days per week, etc.

Please let me know if this distinction makes sense.


Reply