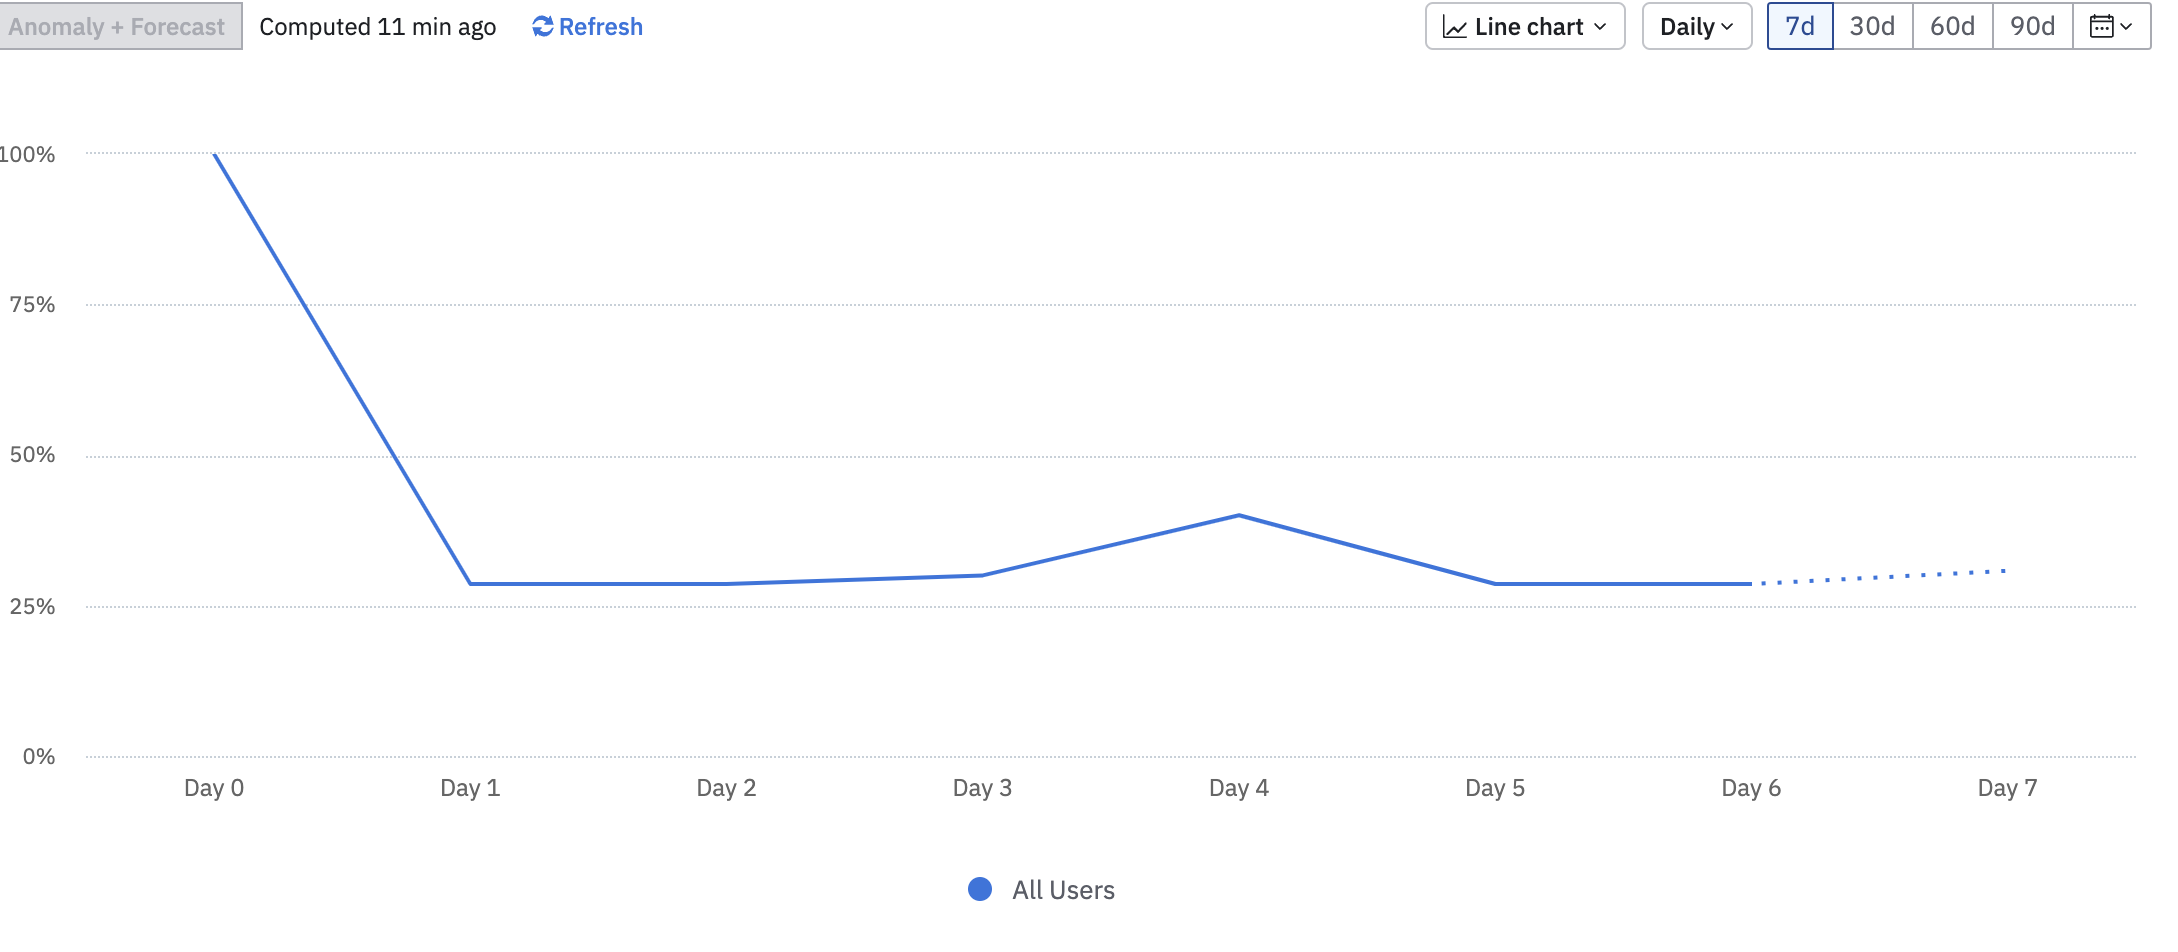
I am sorry for the harsh language but this is absolutely bizarre, convoluted and amateurish. I couldn’t wrap my head around it, because I didn’t think you would make such peculiar logic leaps:
So, basically retention gets calculated as a percentage BUT WITH DIFFERENT COHORTS EACH TIME. This by itself is fine, but who though it was a good idea given said assumptions to put a percentage result??? The least you can do is
- By default show calculations for completed cohorts only e.g I have asked for retention over 7 days perdiods show me only the completed 7-day cohorts.
- Allow me to see absolute numbers! Allow me to see number of users actually having performed the retention.
This, bizarre I repeat combination of calculating + presenting data leads to this head scratcher:

- Each day here has a different percentage
- Day-4 seems to have a higher percentage than a previous day.
- EVERY SINGLE DAY HAS 6 USERS performing the retentions BUT DIFFERENT PERCENRAGE RESULT.
I have read the relevant threads and I know how this works now
But please FOR THE LOVE OF GOD tell your product and data science team that this is the absolutely most weird way to display results!!!
Apologies for the language but I am quite vexed trying to untangle what your product team though it made sense.