Solved

Forecast chart - shading incorrect?


Forum|alt.badge.img

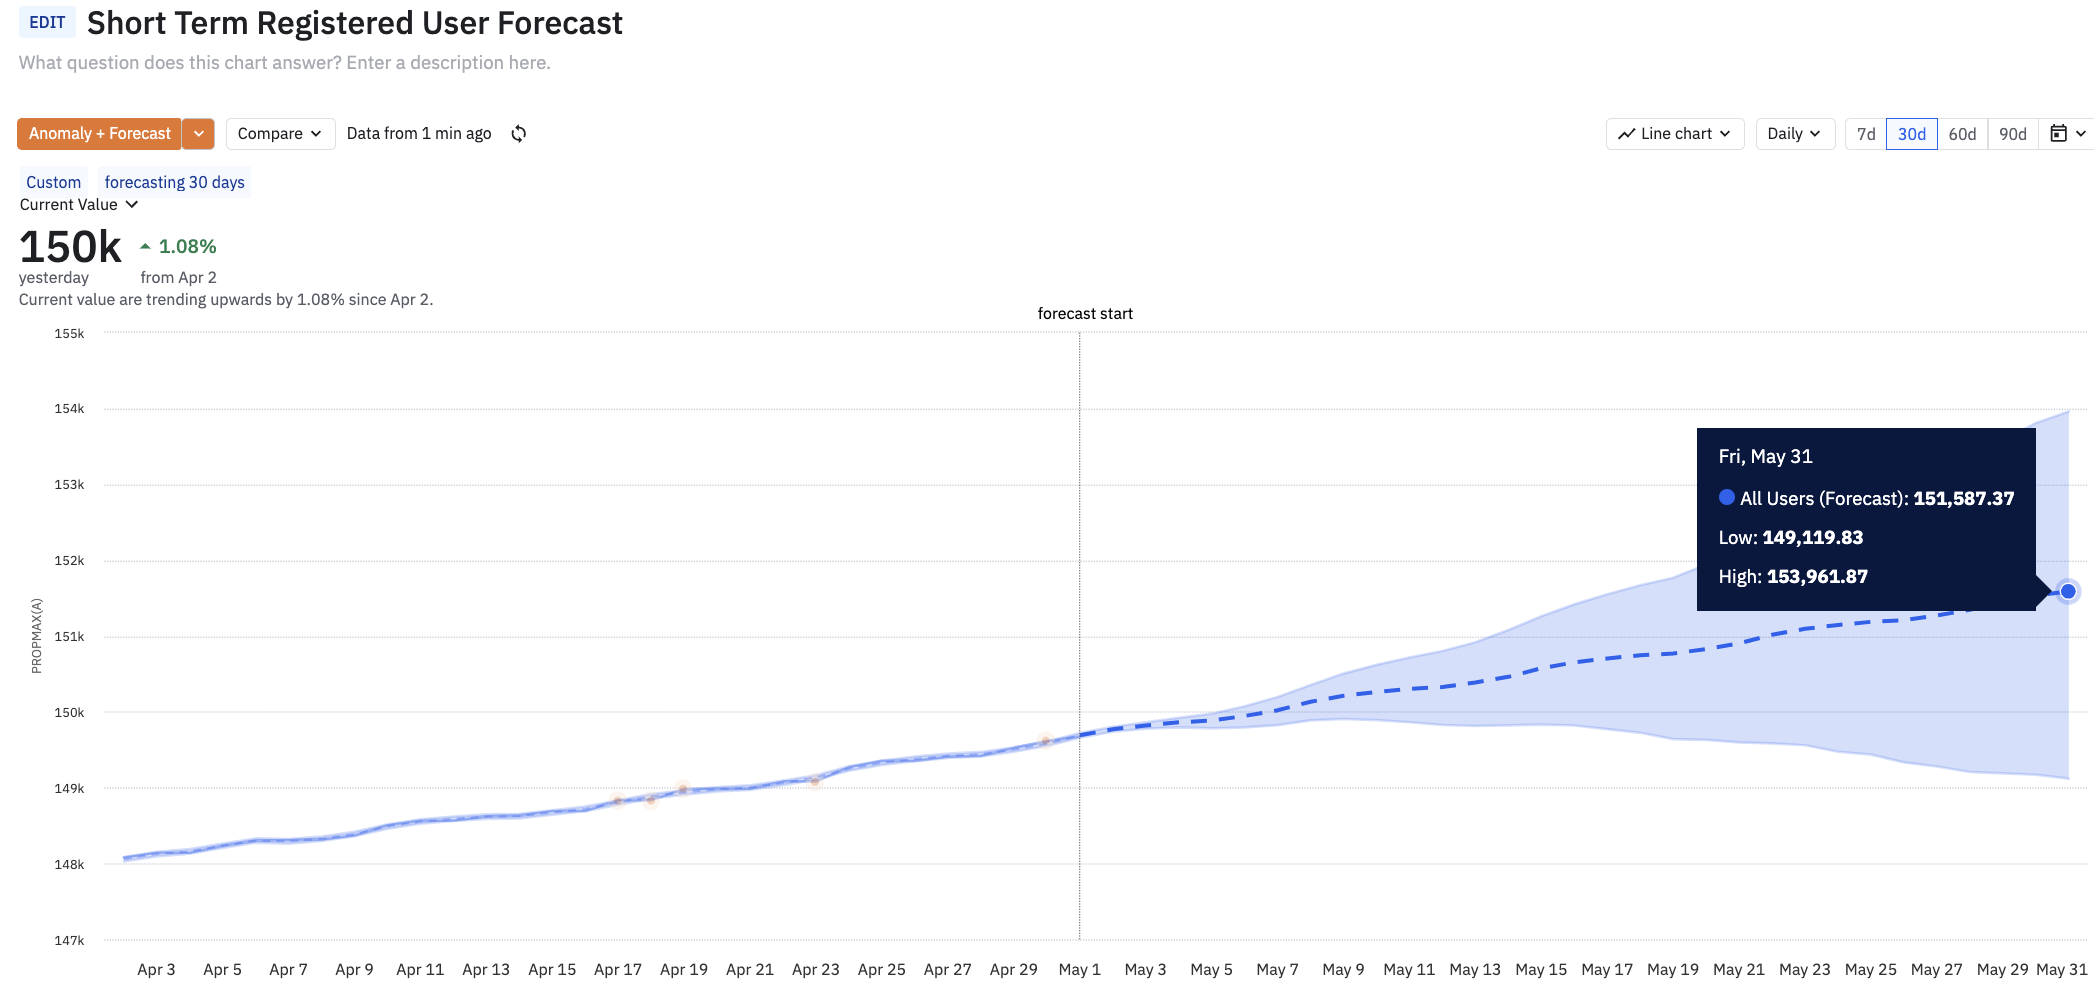
I am using the forecast option to build out projections.

  1. Is it possible to remove the blue shading underneath the line?
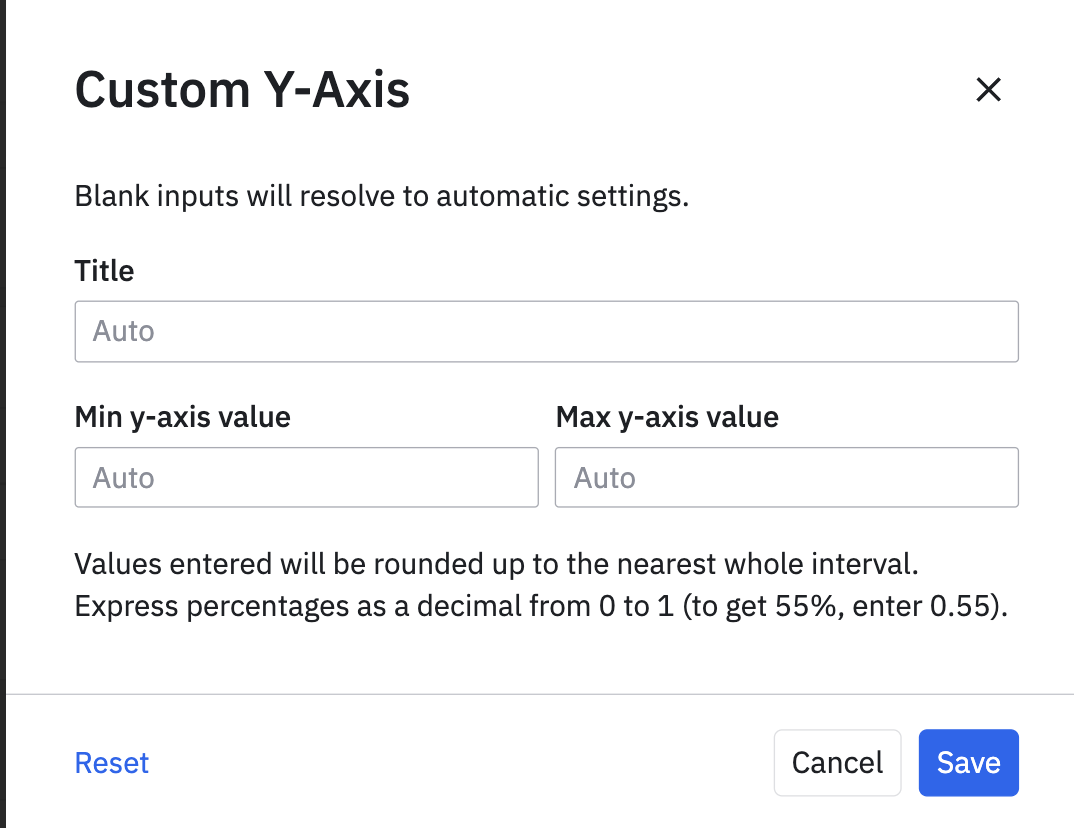
  1. Adjust the axis on the left so the interval does not look so dramatic (as this is meant to be 95% Confidence Limit)


Thanks in advance

Best answer by Saish Redkar

HI @srahman 

Since the light blue band width depends on your data and your custom mode forecast parameters, I don’t think there is much control on the appearance based on how this feature visualizes the forecast.

For #2,  you can click on the Y axis for customizing it.


Hope this helps.

View original
Did this topic help you find an answer to your question?

2 replies

Saish Redkar
Expert
Forum|alt.badge.img+10
  • Expert
  • 1379 replies
  • Answer
  • May 2, 2024

HI @srahman 

Since the light blue band width depends on your data and your custom mode forecast parameters, I don’t think there is much control on the appearance based on how this feature visualizes the forecast.

For #2,  you can click on the Y axis for customizing it.


Hope this helps.


eddie.gaona
Team Member
Forum|alt.badge.img+9
  • Amplitude Support
  • 161 replies
  • May 2, 2024
Hello,

I would agree with Saish on both questions!

For any feature requests we highly encourage our customers to use the in-app widget to submit product feedback.

Hope this helps!

-Eddie


P.S. Checkout upcoming events and user meetups on our events page.

Reply


Cookie policy

We use cookies to enhance and personalize your experience. If you accept you agree to our full cookie policy. Learn more about our cookies.

 
Cookie settings