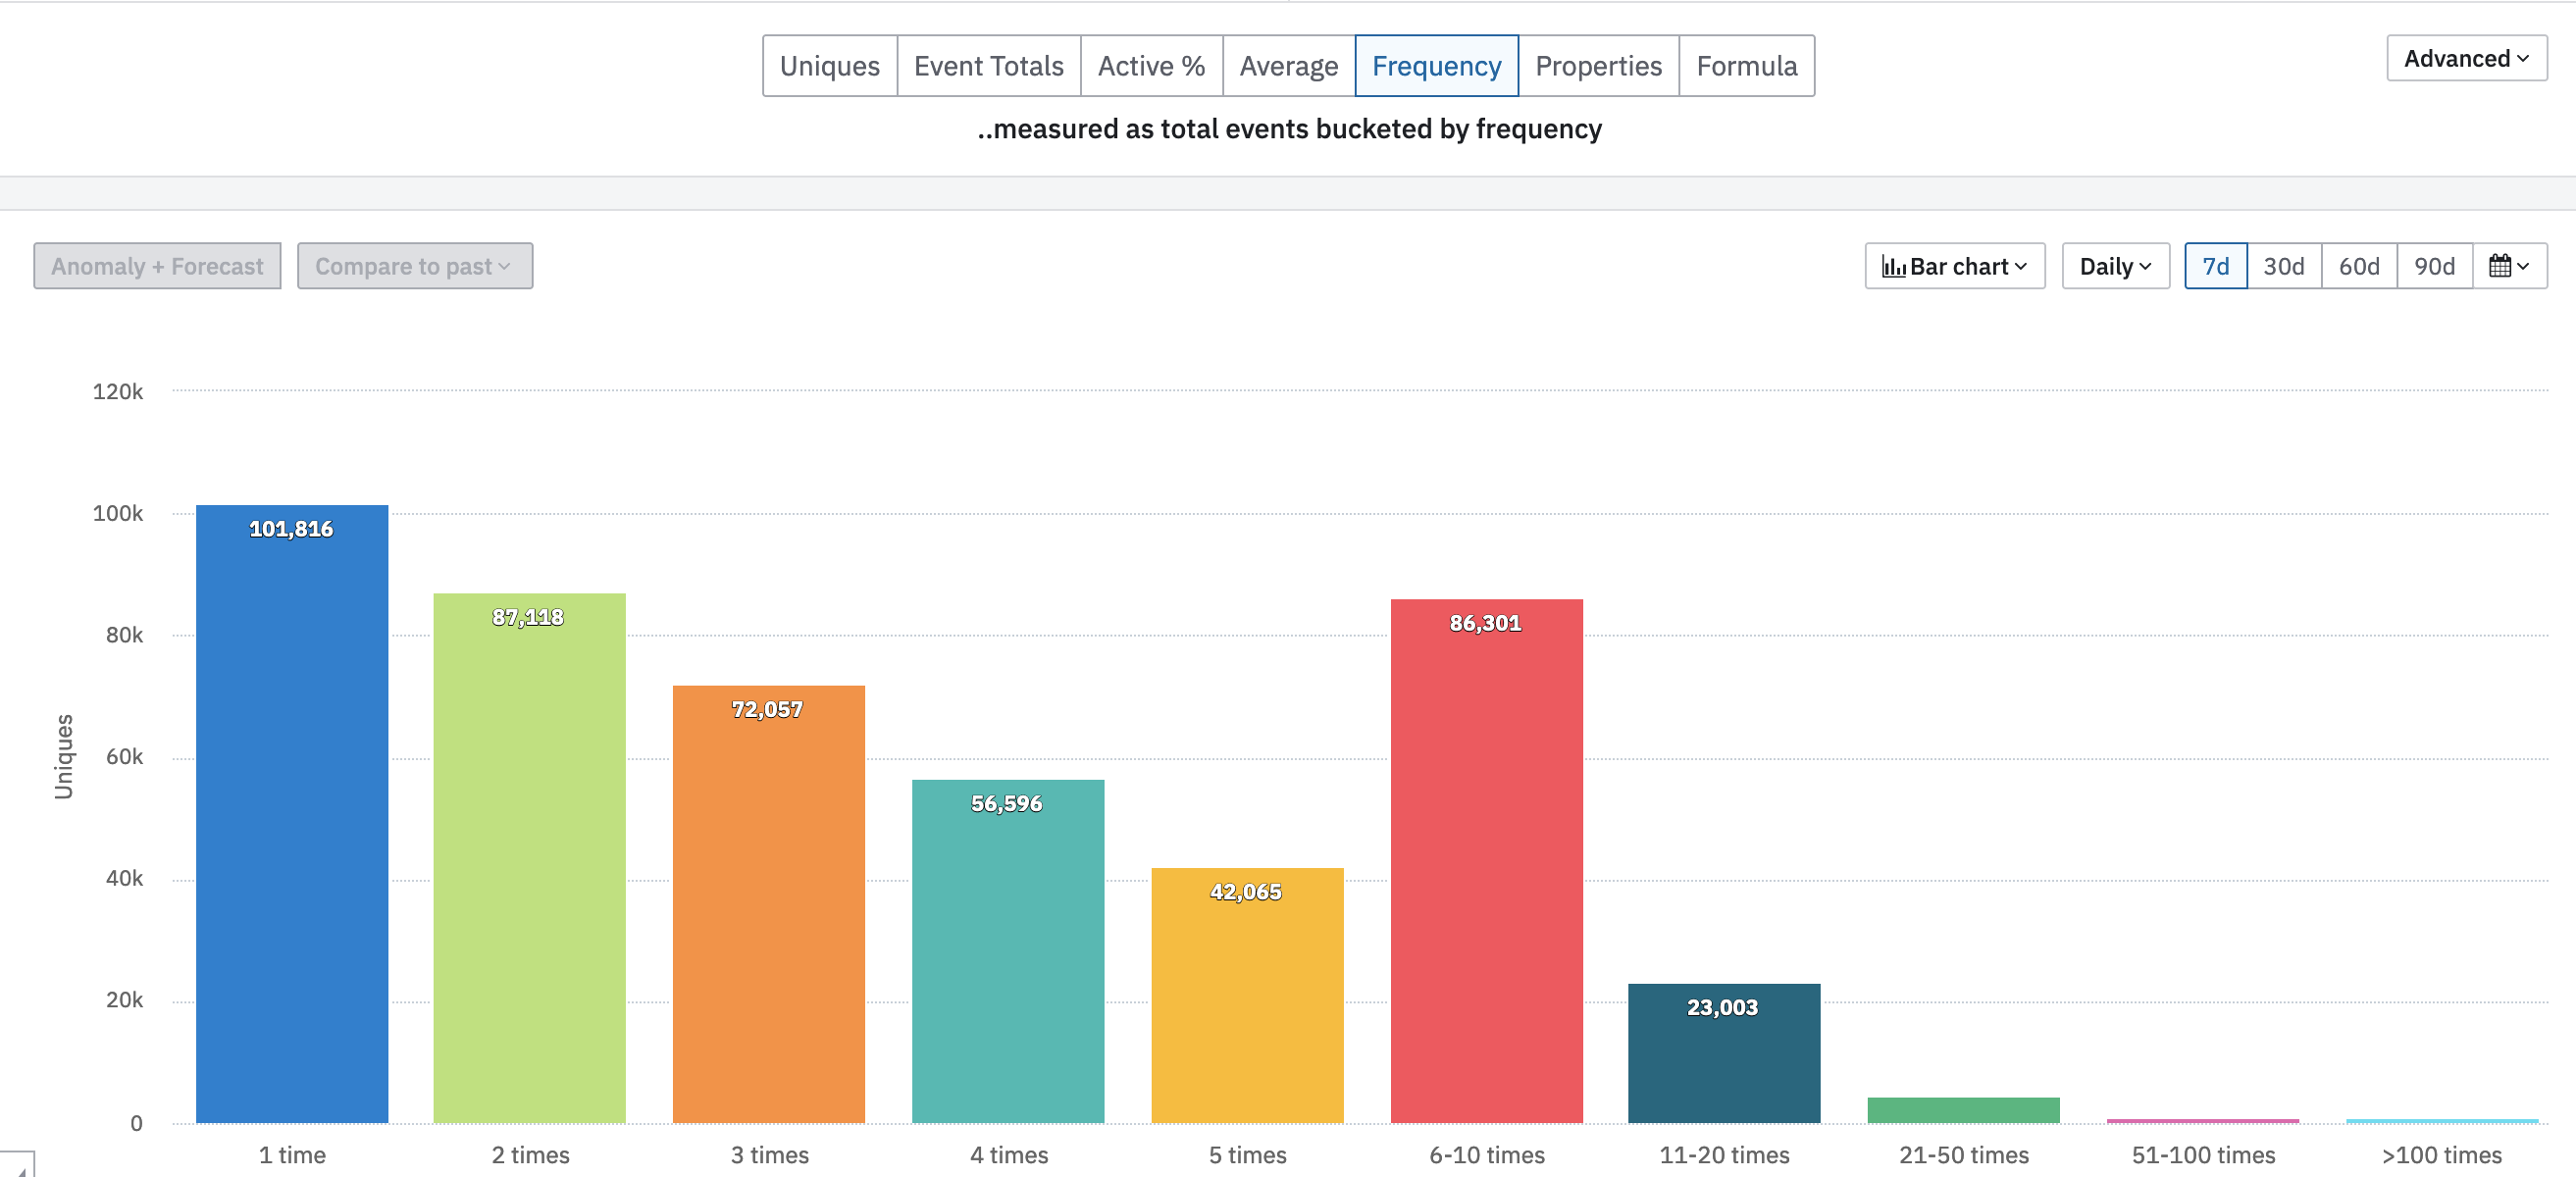
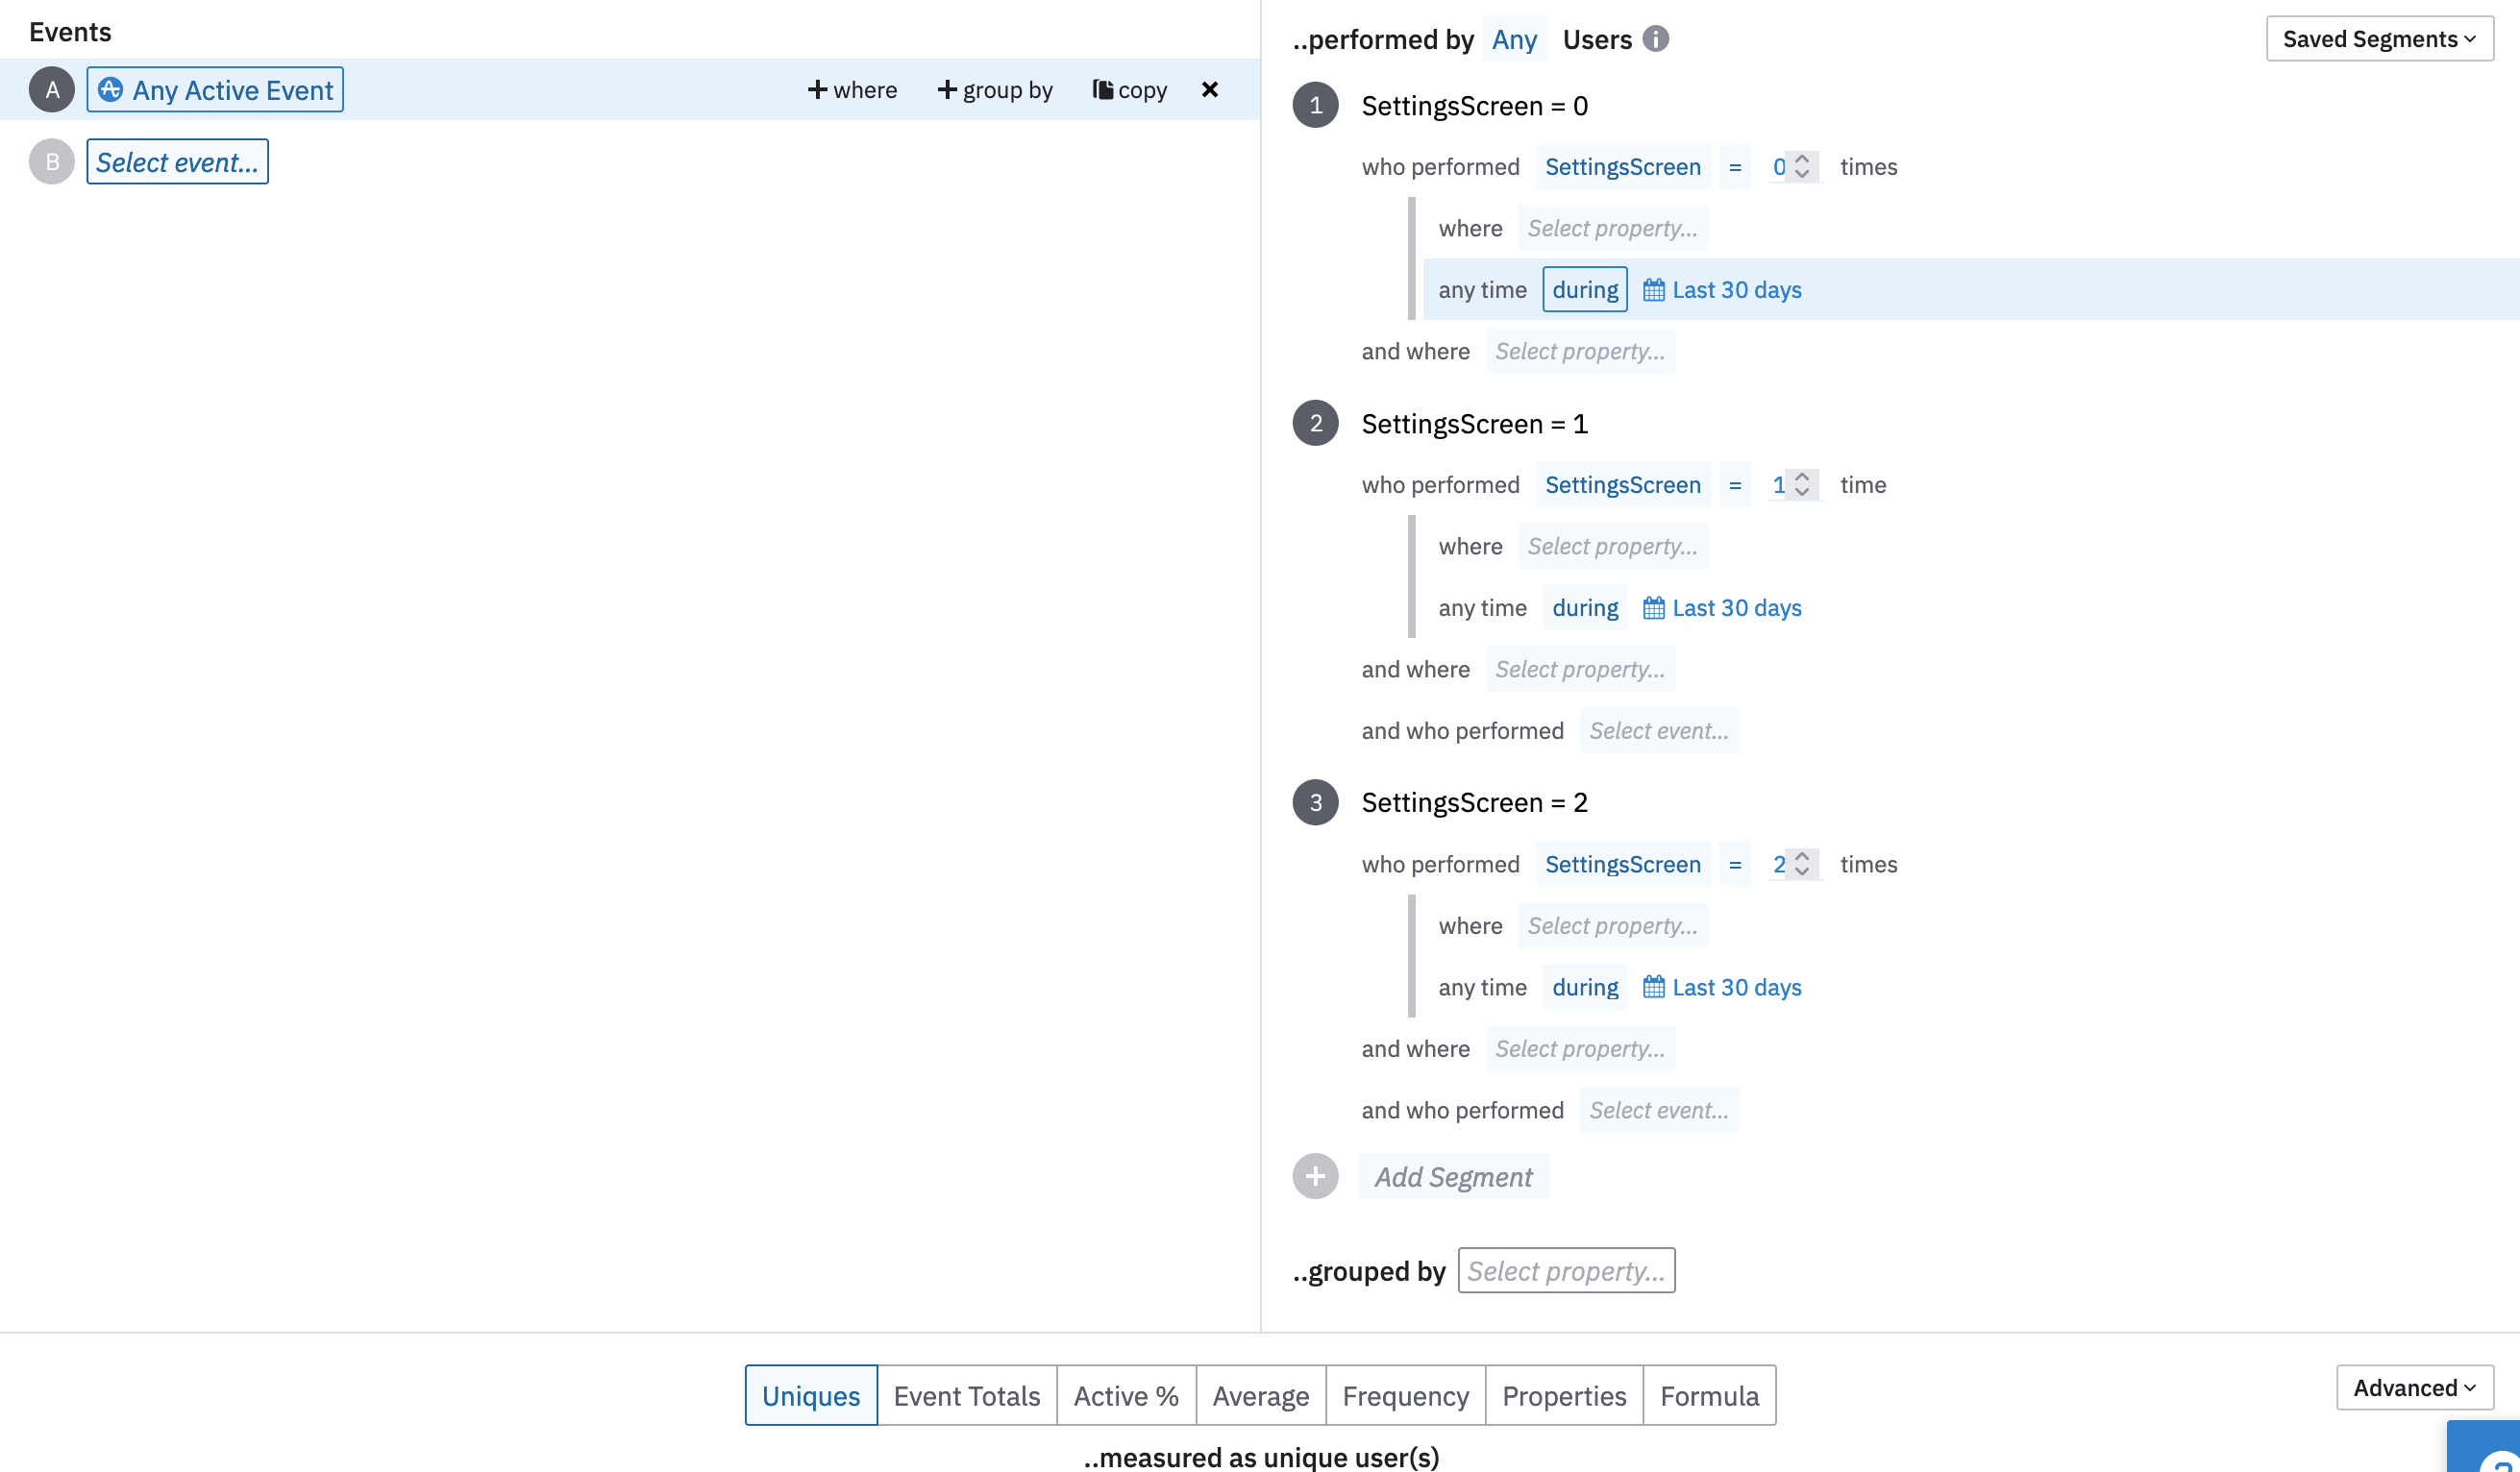
I’m trying to see a distribution (Bar chart) of the number of users who triggered an event: Zero times; Once; Twice; Three times; Four times; etc… for all valid number of events triggered by one or more users in the period.
So the result should show:
zero Times: 10 users
Once: 9 users
Twice: 4 users
Three times: 2 users
Four times: 1 users
Any ideas on how I could achieve this?