Solved

Don't know a section's meaning in the funnel

  • 15 December 2021
  • 4 replies
  • 135 views

Badge

Hi, 
I found discrepancy between funnel analysis and show user paths.


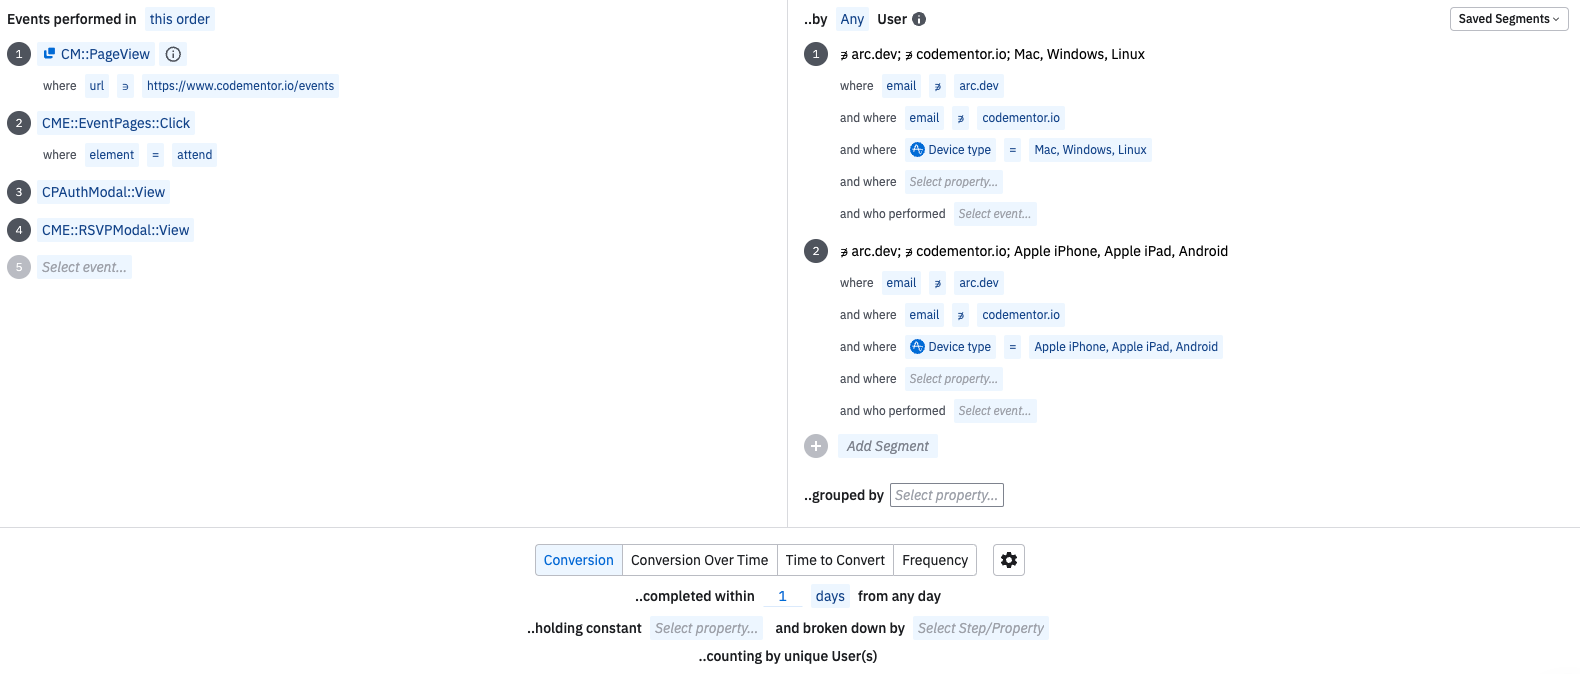
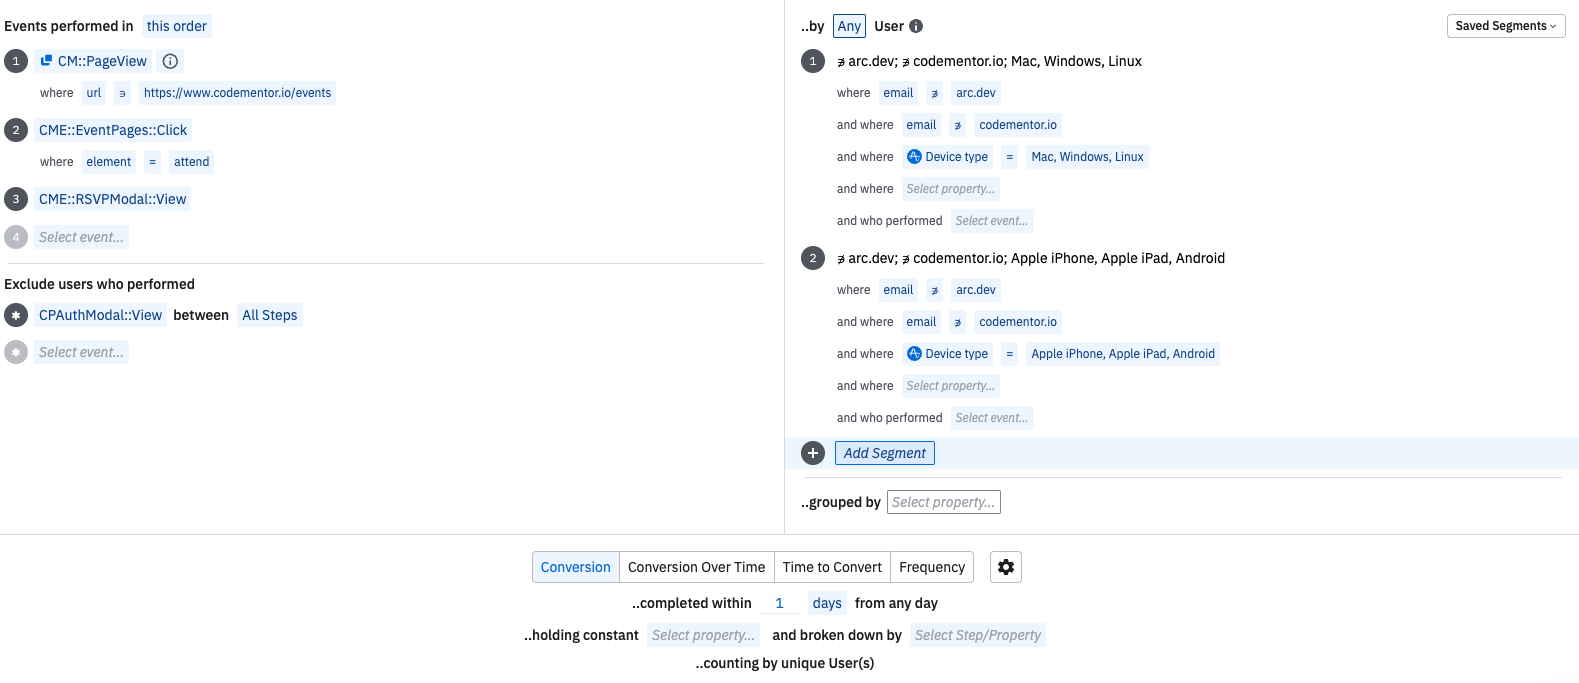
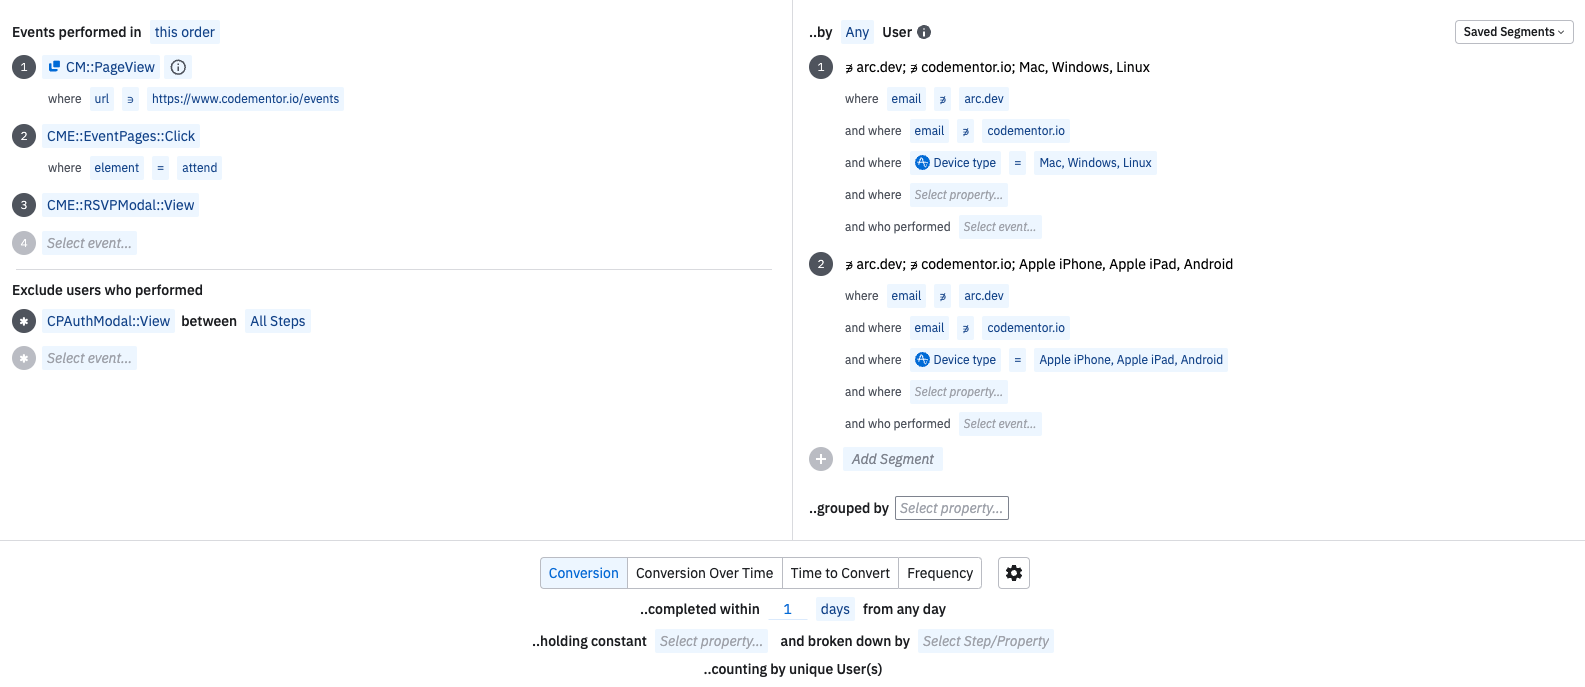
Here are my settings:
excluding users who performed Auth modal


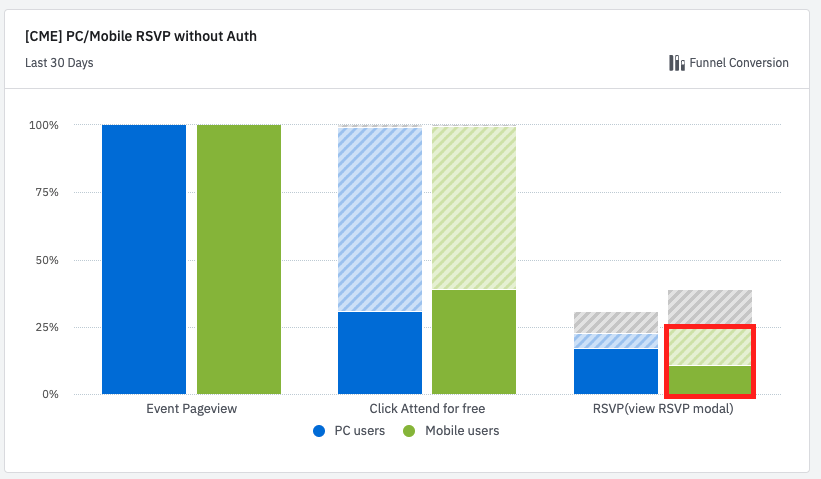
The result is as follows:

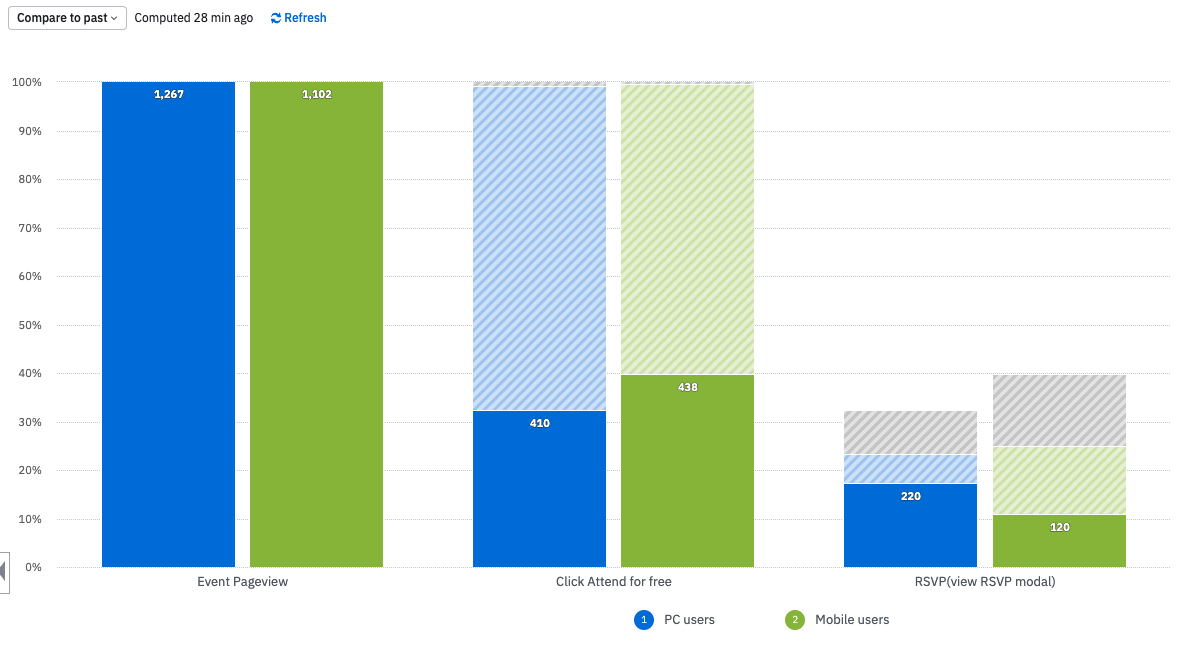
As for the third bar, my understanding is 

  1. Gray area is the No. of users who performed Auth Modal, so it is excluded
  2. Heavy Green area is the No. of users who didn’t perform Auth Modal and did the actions what I need

What I didn’t know is what the light green area mean?


In my assumption, I think the area from Light Green area and Heavy Green area mean users who didn’t performed the Auth Modal.


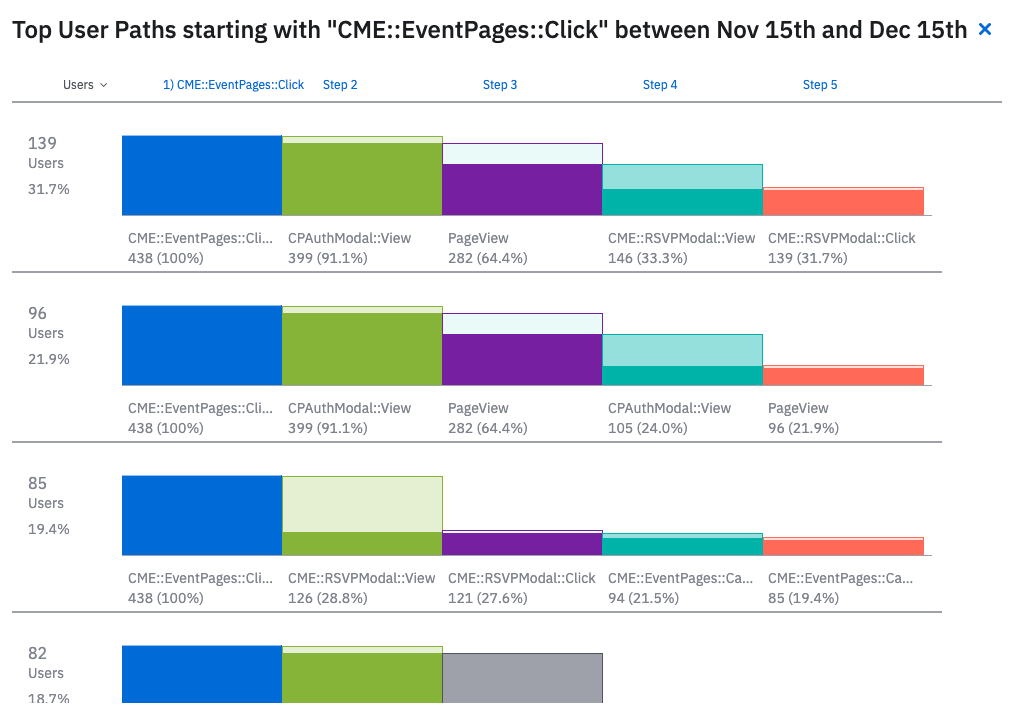
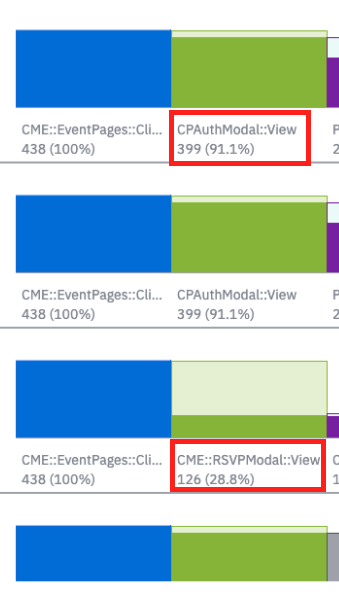
But after looking into the “show user paths”, the percentage of user who didn’t performed Auth Modal is only 28.8%(who perform RSVP modal), which is near the number of Heavy Green area.


Where did the light green area come from?

icon

Best answer by sydney.koh 16 December 2021, 17:35

View original

4 replies

Userlevel 5
Badge +8

Hi Richard!


The light green area is users who did not perform the excluded event and users who did not convert. So they are did not perform that Funnel step but they also did not perform Auth modal so they are not excluded. 


User paths it will show you what most users did right after completing that step. User Paths also takes all event paths so if a user performed the first event more than one time all event paths will show in this view. The Funnel Analysis chart is looking at "this order" and completed within 1 day. This means a user has to complete all the steps in the Funnel within 1 day of entering the funnel. The user enters the funnel by performing step 1 of the funnel. Funnel will only count the users first conversion that meets your filter requirements.

In summary the user paths is showing immediate actions taken after step 1. The Funnel chart is looking if the users performed all these events within 1 day of first appearing in the Funnel.


Hope this helps let me know if you have questions!


Best,

Sydney

Badge

Hi @sydney.koh ,

Thanks for your reply!


From your response, I know the reason why sum of percentage in the second step in the user paths is more than 100% (91.1% + 28.8%), which is because a person would appear in both user paths if he/she performed 2 different actions.


Is that correct?

---


Based on your response, I have another question:


The two screenshots below are my charts, one has “View Auth” in the funnel, the other excluded “View Auth” in the steps. What I don’t understand is “Why is the sum of No. of users within the red frame not equal to the No. of users in previous step?”


with Auth​​
without Auth


For the chart “with Auth”, the users within red frame means users who performed Auth, while for the chart “without Auth”, the users with red frame means No. of user who didn’t performed Auth because users who performed Auth would be colored as “Grey”.


According to your response, a person would only be counted once in the funnel (when appeared in the funnel the first time). Therefore, I would expect the sum of users within red frame in two charts would be equal to the No. of users in the second step because they fulfill the MECE framework (Mutually Exclusive, Collectively Exhaustive).


Is there anything wrong in my understanding?


Thanks!


The settings of two charts are attached for your reference:

settings of with Auth
setting of without Auth


Badge

Hi @sydney.koh ,
my question is shown as “solved”, while it is not. Is that normal?

Thanks!

Userlevel 5
Badge +8

Hi Richard!


You are correct for user paths a user can be in more than one user path. I marked it as solved because in your original question there was only one question! For your follow up questions it will involve looking into your users further so I am going to reach out to you separately to investigate. Please check your spam inbox as well as your regular email inbox. 


Best,

Sydney


Reply