Solved

Connect Amplitude to Qlik

  • 4 February 2022
  • 9 replies
  • 234 views

Badge

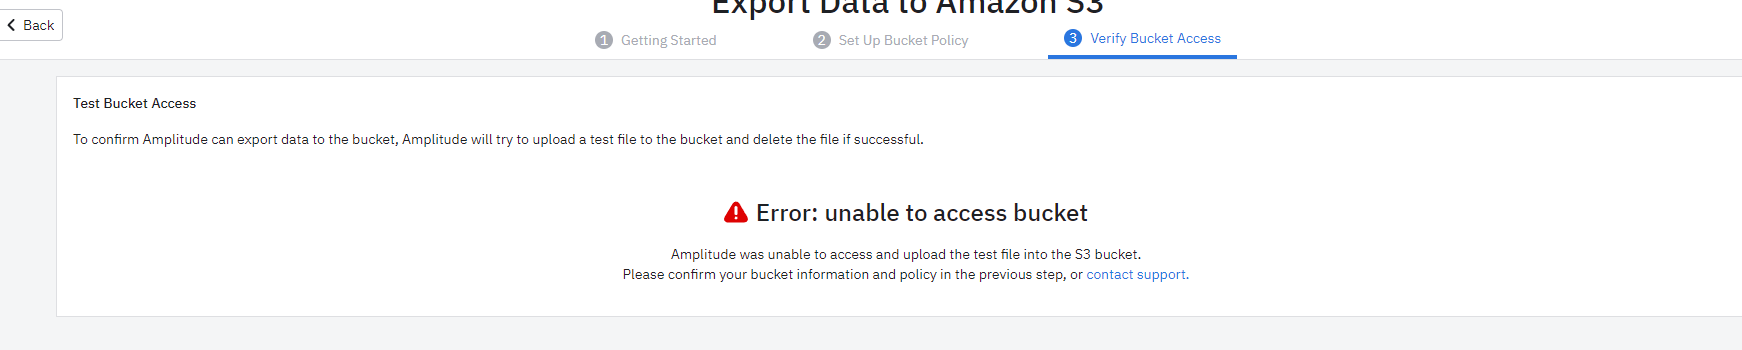
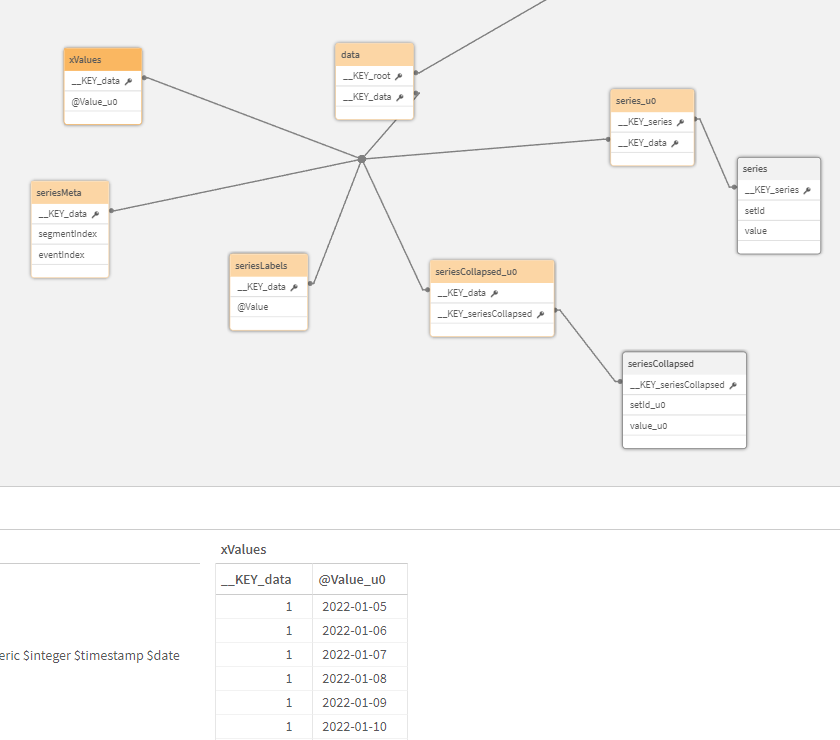
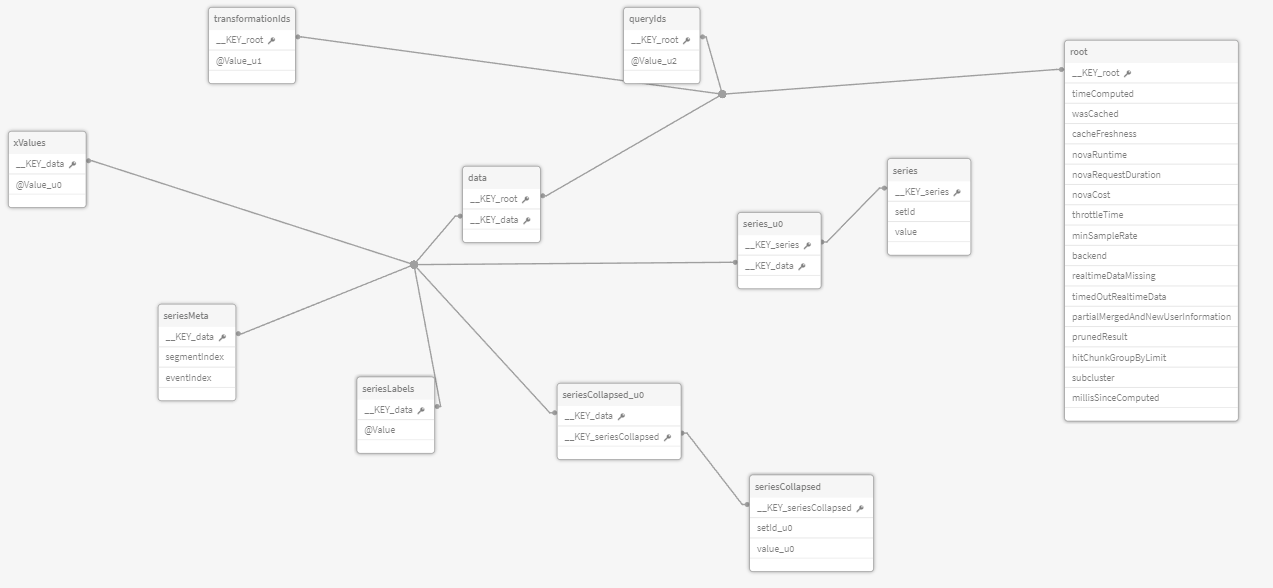
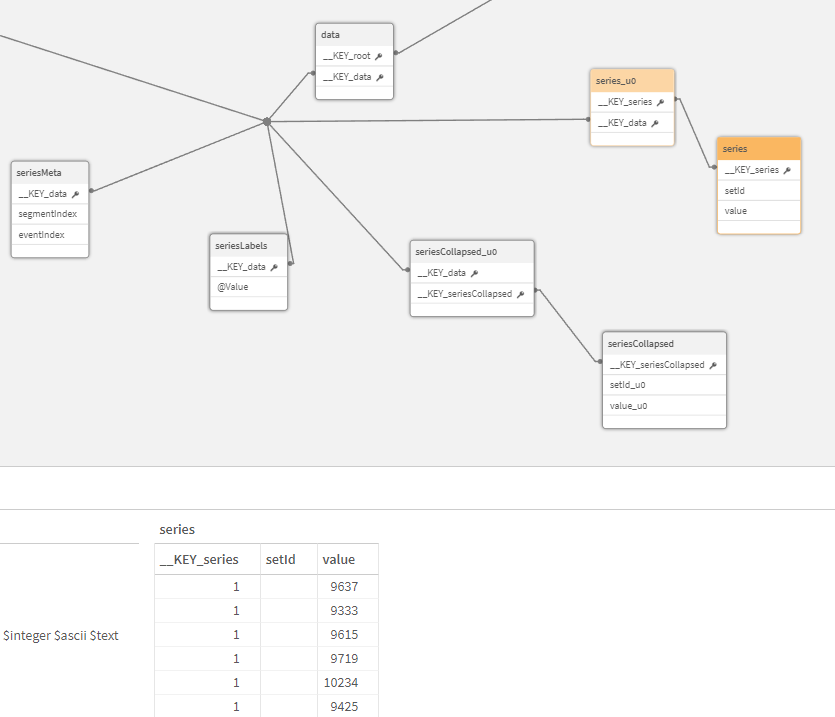
Hello, has someone tried to connect Amplitude to Qlik via the REST API? I connected it but the results I am getting are not in the wished format. I used the dashboard API to get a simple DAU report, I get the number of users, I get the date, but I can’t connect them together.


icon

Best answer by Saish Redkar 7 February 2022, 20:45

View original

9 replies

Userlevel 7
Badge +10

Hey @John_SM 

I’m not quite familiar with how Qlik works here, but depending on what call you are making to the /api/2/events/segmentation end point, the raw data points returned would be nested as json lists/objects. The main datapoints to look here are the series and xValues, which you have already extracted in the above data model.

The xValues is an array of string dates in the form "YYYY-MM-DD", one for each date in the specified range depending on time interval you have chosen.The series is an array with one element for each group, in the same order as "seriesLabels", where each element is itself an array that contains the value of the metric on each of the days specified in "xValues".

For a simple DAU chart without any group by, each value in the series array would be the user count ( unique or total depending on the API parameter m you chose) corresponding to the date string value in the xValues array.

I would check if it’s possible in Qlik to just look at the series and xValues array tables and join the two to get the DAU report in a tabular format.

Badge

Hi @Saish Redkar, thank you for your response. Thats the issue, the response I get from Amplitude is a nested json and qlik makes a table for each object. With Qlik I can get only the series and xValues tables but the problem is the join key, as in the pictures above I am getting only 1 as key so I don’t know how to make the join if the key is the same for all rows

Userlevel 7
Badge +10

From what it looks like,  the join won’t be straightforward without the key, given that there can’t be much done on how the REST API returns the data. Is there any other way Qlik can extract these responses to avoid this issue?

If you are okay not leveraging the REST API and cool playing with raw event data, the long shot would be setting up recurring exports of your project data to the cloud destination of your choice ( S3, Snowflake, GCS ) directly from the Amplitude. Maybe then try to connect Qlik to these destinations and get the desired data using some basic SQL for DAU calculation.

Userlevel 6
Badge +8

Hi @John_SM ,


I agree with @Saish Redkar here, without primary keys to join the tables, it will not be easy. However, if you can import data in Qlik with their system, I think it would be best to set up an export of your data with the Export API and then manually import the raw data that is exported into the Qlik system. The exported data will be given in a zipped file of different JSON objects all representing the data that you have in the Amplitude system (maximum export of 1 year so you may need to do a few import) and then re-import the data in Qlik. 


I hope this helps! If Amplitude can help any further, please tag me here and I will help as much as I can. 


Kind Regards,

Denis

Badge

I will try that option, thank you all for the answers

Badge

Hi @Saish Redkar  and @Denis Holmes , is there an option to export the data automatically from Amplitude in excel/csv format? I know that I can export the csv file from different charts, but I would need to do this on a regular basis so doing it with some scheduled export jobs/tasks would help.

Userlevel 6
Badge +8

You have the Export API but this is done through zipped JSON files. You could use the Dahsboard REST API which will allow you to query against charts and their data to get the raw data that is returned from them.

For more information on the REST API and it’s capabilities, please see https://developers.amplitude.com/docs/dashboard-rest-api. I hope this helps! Let me know if you need any further clarity.

Userlevel 7
Badge +10

I would go with Denis’ suggestion here.

Export API won’t give you csv files, but zipped JSON files. You will have to crunch the raw data from these to get your desired data.

Using the  Dashboard REST API, you can schedule some jobs on extracting the results depending on what chart data you are looking for.

Badge

Hi @Denis Holmes , sorry to come back to this, but I have another issue. Do you know if Amplitude is compatible with Wasabi (we are now using Wasabi in the company instead of S3 and Wasabi says that they are 100% compatible just like Amazon S3). My problem is that I get permission error at the last step. I copy the bucket policy generated to Wasabi go to the last step, but still get that error, even though I can connect to that wasabi bucket, so I have the permissions.


Reply