Solved

Use "Money Spent" User Property to segment users

  • 3 November 2021
  • 5 replies
  • 396 views

Badge

Hi,
I am new to this community, but not new to Amplitude. I used it for my own Freemium app a couple of years back and introduce it to my new project now.

While my old product was a subscription based service, the new one is more like a free-to-play game where you can purchase upgrades.

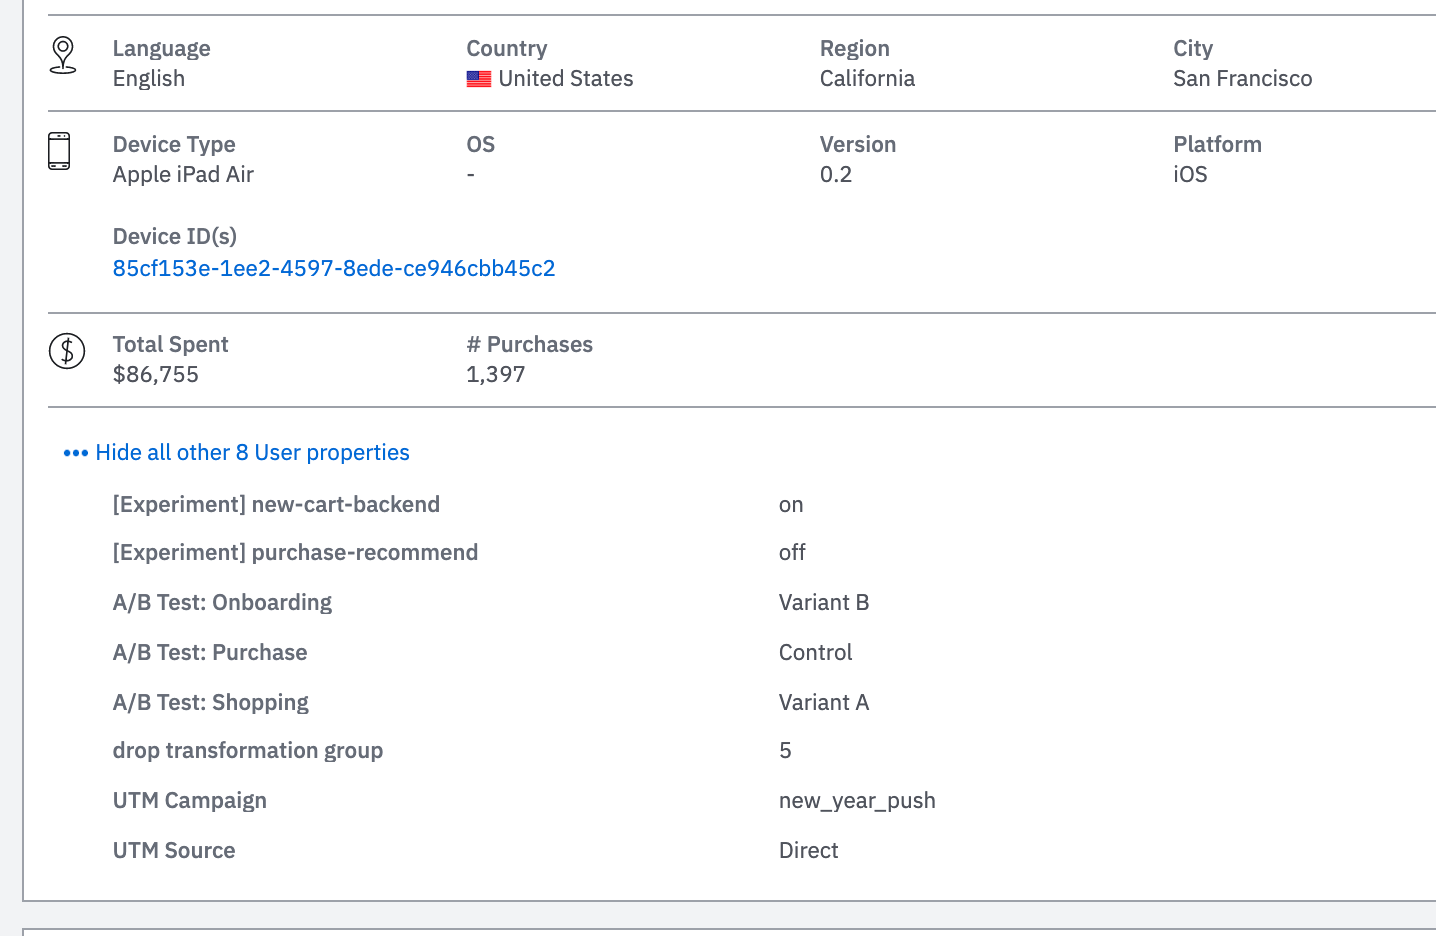
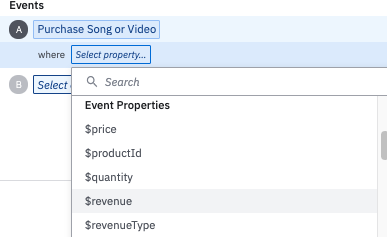
I was able to connect the revenue events to Amplitude correctly and can run revenue analysis. However, I seem to have hit a dead end when it comes to using the user properties related to revenue that Amplitude provides (see screenshot below)


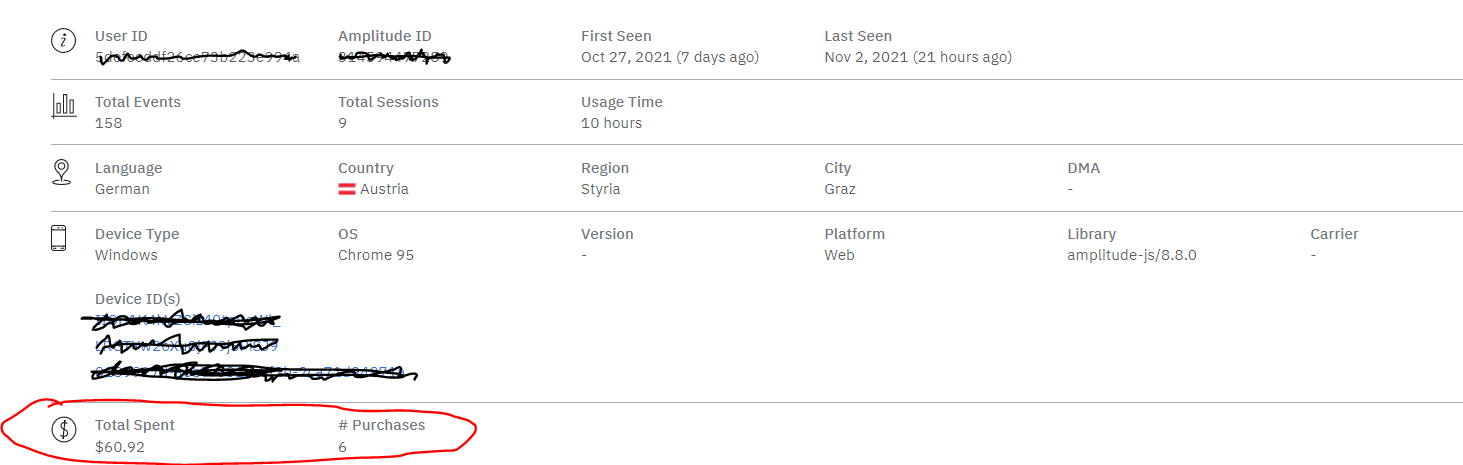
I can see the values in the user profiles, and they seem to be correct. However, I cannot access this user property when I try to create a segmentation analysis. I would like to see the different user behaviour based on if and how much our customers have purchased, but when I browse through the user properties, these two are nowhere to be found.

Hope someone can help me. thanks in advance.

icon

Best answer by tracy.guo 3 November 2021, 19:59

View original

5 replies

Userlevel 7
Badge +10

Hey @Christoph_Sch 

From what I understand, the revenue properties shown in the user profile are shown as aggregated based on the ones you are sending with your revenue events. They aren’t technically user properties in this context.

If you see above, there are 3 distinct sections in the profile 

  • Default Amplitude User Properties and some pretty basic usage metrics for that user
  • The aggregated revenue stats/properties - total spent and # purchases
  • Custom User Properties


The qty and revenue appear as revenue properties ( prefixed with $) under the event properties dropdown based on how you have instrumented your revenue event.

I haven’t found any specific documentation yet which explains Total Spent and # Purchases in the user profile. @tracy.guo, can you point out if there is any link out there?


Hope this helps!


Badge

Thanks for taking the time to help me, @Saish Redkar . Much appreciated.

I find it odd that Amplitude displays the information in between all kinds of user properties, but doesn’t make it available for segmentation. Also, I would consider this to be a pretty basic data request and I wonder why it has not been solved.

We could send this from our backend to the user properties via the node.js API, so I guess we’ll do that

Userlevel 4
Badge +3

Hi @Christoph_Sch and @Saish Redkar ! 

Saish is completely correct that the Total Spent and # Purchases is an aggregate value based on how many events in the user’s event stream have the “$revenue” property and the sum of the $revenue values. It looks like we did not specify this information in our documentation so I’ve gone ahead and added a note here: https://help.amplitude.com/hc/en-us/articles/229313067#User-Profile

You can recreate the Total Spent metric (to a degree) by using a custom formula in the event segmentation chart - either PROPSUM or REVENUETOTAL - and grouping your revenue event by the $revenue property. Use a bar chart visualization to see a total. You can also recreate the # Purchases using the Event Totals metric and filtering for events where “$revenue” is not (none).
The reason I said “to a degree” is because these charts have date range limitations. For example, a chart using “Daily” as the interval is still limited to displaying 365 days of data. You can consider using a Monthly or Quarterly interval instead to look at a larger span of data.

A key understanding about Amplitude charts and cohorts are that they are event-based. This means that they are querying on the property values at the time of the event. For the Total Spent and # purchases, this is the current aggregate of a user’s events which is updated over time. At this time, it is not a user property value that is automatically logged by Amplitude. 

As Christoph already suggested, sending this information as user properties would be the best way to query on this information in a chart as a property. 

Hope this helps clarify the nature of the Total Spent and # Purchases values in the user profile! Let me know if you have any questions!

Userlevel 7
Badge +10

Hey @tracy.guo 

Thanks for jumping in and making the edit in the docs! Really helpful. 

Hi there! I know this is a little old, but is it possible for someone to clarify what @tracy.guo meant about using a custom formula in the event segmentation chart? I don’t see something called “PROPSUM” or “REVENUETOTAL” and am not sure where to look. My end goal is to segment users by the total amount they’ve spent -- e.g. # of users who spent between $1-100 total, # who spent $101-500 total, etc. Is that possible? Thank you!

Reply