Use eventing to track possible permutations for items in a custom list?


Badge

Hello Amplitude Hive Mind, 


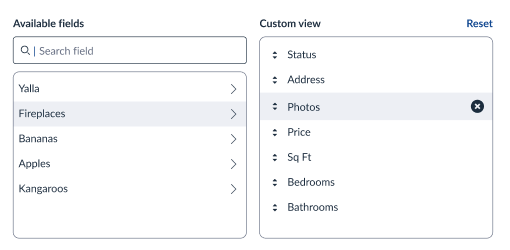
Wondering if there’s a way (or if it’s even recommended) to use Amplitude eventing to figure out what all the possible permutations in a custom list are? You know this type of list, it’s where you can add/remove headers in a list to create your own custom view (like in excel or any column/row type tool). Basically, we’re trying to figure out how we can understand what the most common custom fields in a list are for all of our users. 


Thanks in advance!


5 replies

Badge

Bump in case anyone can provide some insight or help here

Userlevel 7
Badge +10

Hey @jackrobins2022

Not sure I completely understand you question here. Are you trying to send an array as a user property and see the most common occurring values ?

You can try the event seg chart and group by that property. This will breakdown the array as individual values. In the demo chart, we have a playlist array property

There’s also the user composition chart which you can apply for this property.

But if you are trying to see all possible value combinations of the array property as a whole value, then sending as an array list won’t help much since Amplitude will process each of individual items in the array separately.

Let me know if this is what you were looking for.

Badge

Hi @Saish Redkar , 

Thanks so much for your reply. Here’s a little more context into what I’m trying to do. Basically, we have available fields in one list and then a custom list view next to it. Users can click or drag/drop fields from the available fields list into the custom list view to tailor their custom list to their preferences. Looks something like this: 

In essence, the questions we’re trying to answer are: What combination of fields in custom view is the most popular permutation/configuration? Which fields are least popular?

I’m just trying to see if we can capture through amplitude eventing the different field permutations on the custom view of all the fields that a user has added to their custom view so we can figure out what’s the most popular permutation vs least popular. 


So for example, can we create an event that says: The most popular custom view has these fields: Status, Address, Bedrooms, and Bathrooms. The next most popular custom view has Sq Ft, Bathrooms, and Price, etc.

Userlevel 7
Badge +10

Thanks for elaborating the use case.

I’m assuming here that you have an event like Custom View Created or Updated and the field_list as an event property?

1. What combination of fields in custom view is the most popular permutation/configuration?

  • As far as I understand, this will have to be captured as a whole value, possible as a string, to display as a singular value when you group by this event.
    • e.g. field_list = “ Status, Address, Photos, Price”
    • I’m not quite sure about the best way to manage this schema though since the item count could make this value difficult to visualize in an event seg chart. e.g if there are 10 items in the selection.


2.  Which fields are least popular?

  • This can be done by sending the field list as an array as I mentioned in the previous reply. Sending as an array list will process each of individual items in the array separately. So a group by on this list will help in seeing the actual counts of individual field items.
    • field_list = [Status, Address, Photos, Price]

You will have to find the right balance or send the properties in both ways to see which works best. If you have access to it, you can also try to see if Derived Properties can help by experimenting with a json like event property schema.

Hope this helps.

Userlevel 6
Badge +9

Thank you for being so supportive @Saish Redkar. You’re the best! 😃

Reply