Solved

Get the last day of a month that is a sum of a daily property.

  • 26 November 2022
  • 8 replies
  • 139 views

Badge

Hello everyone, I need help with a custom formula.

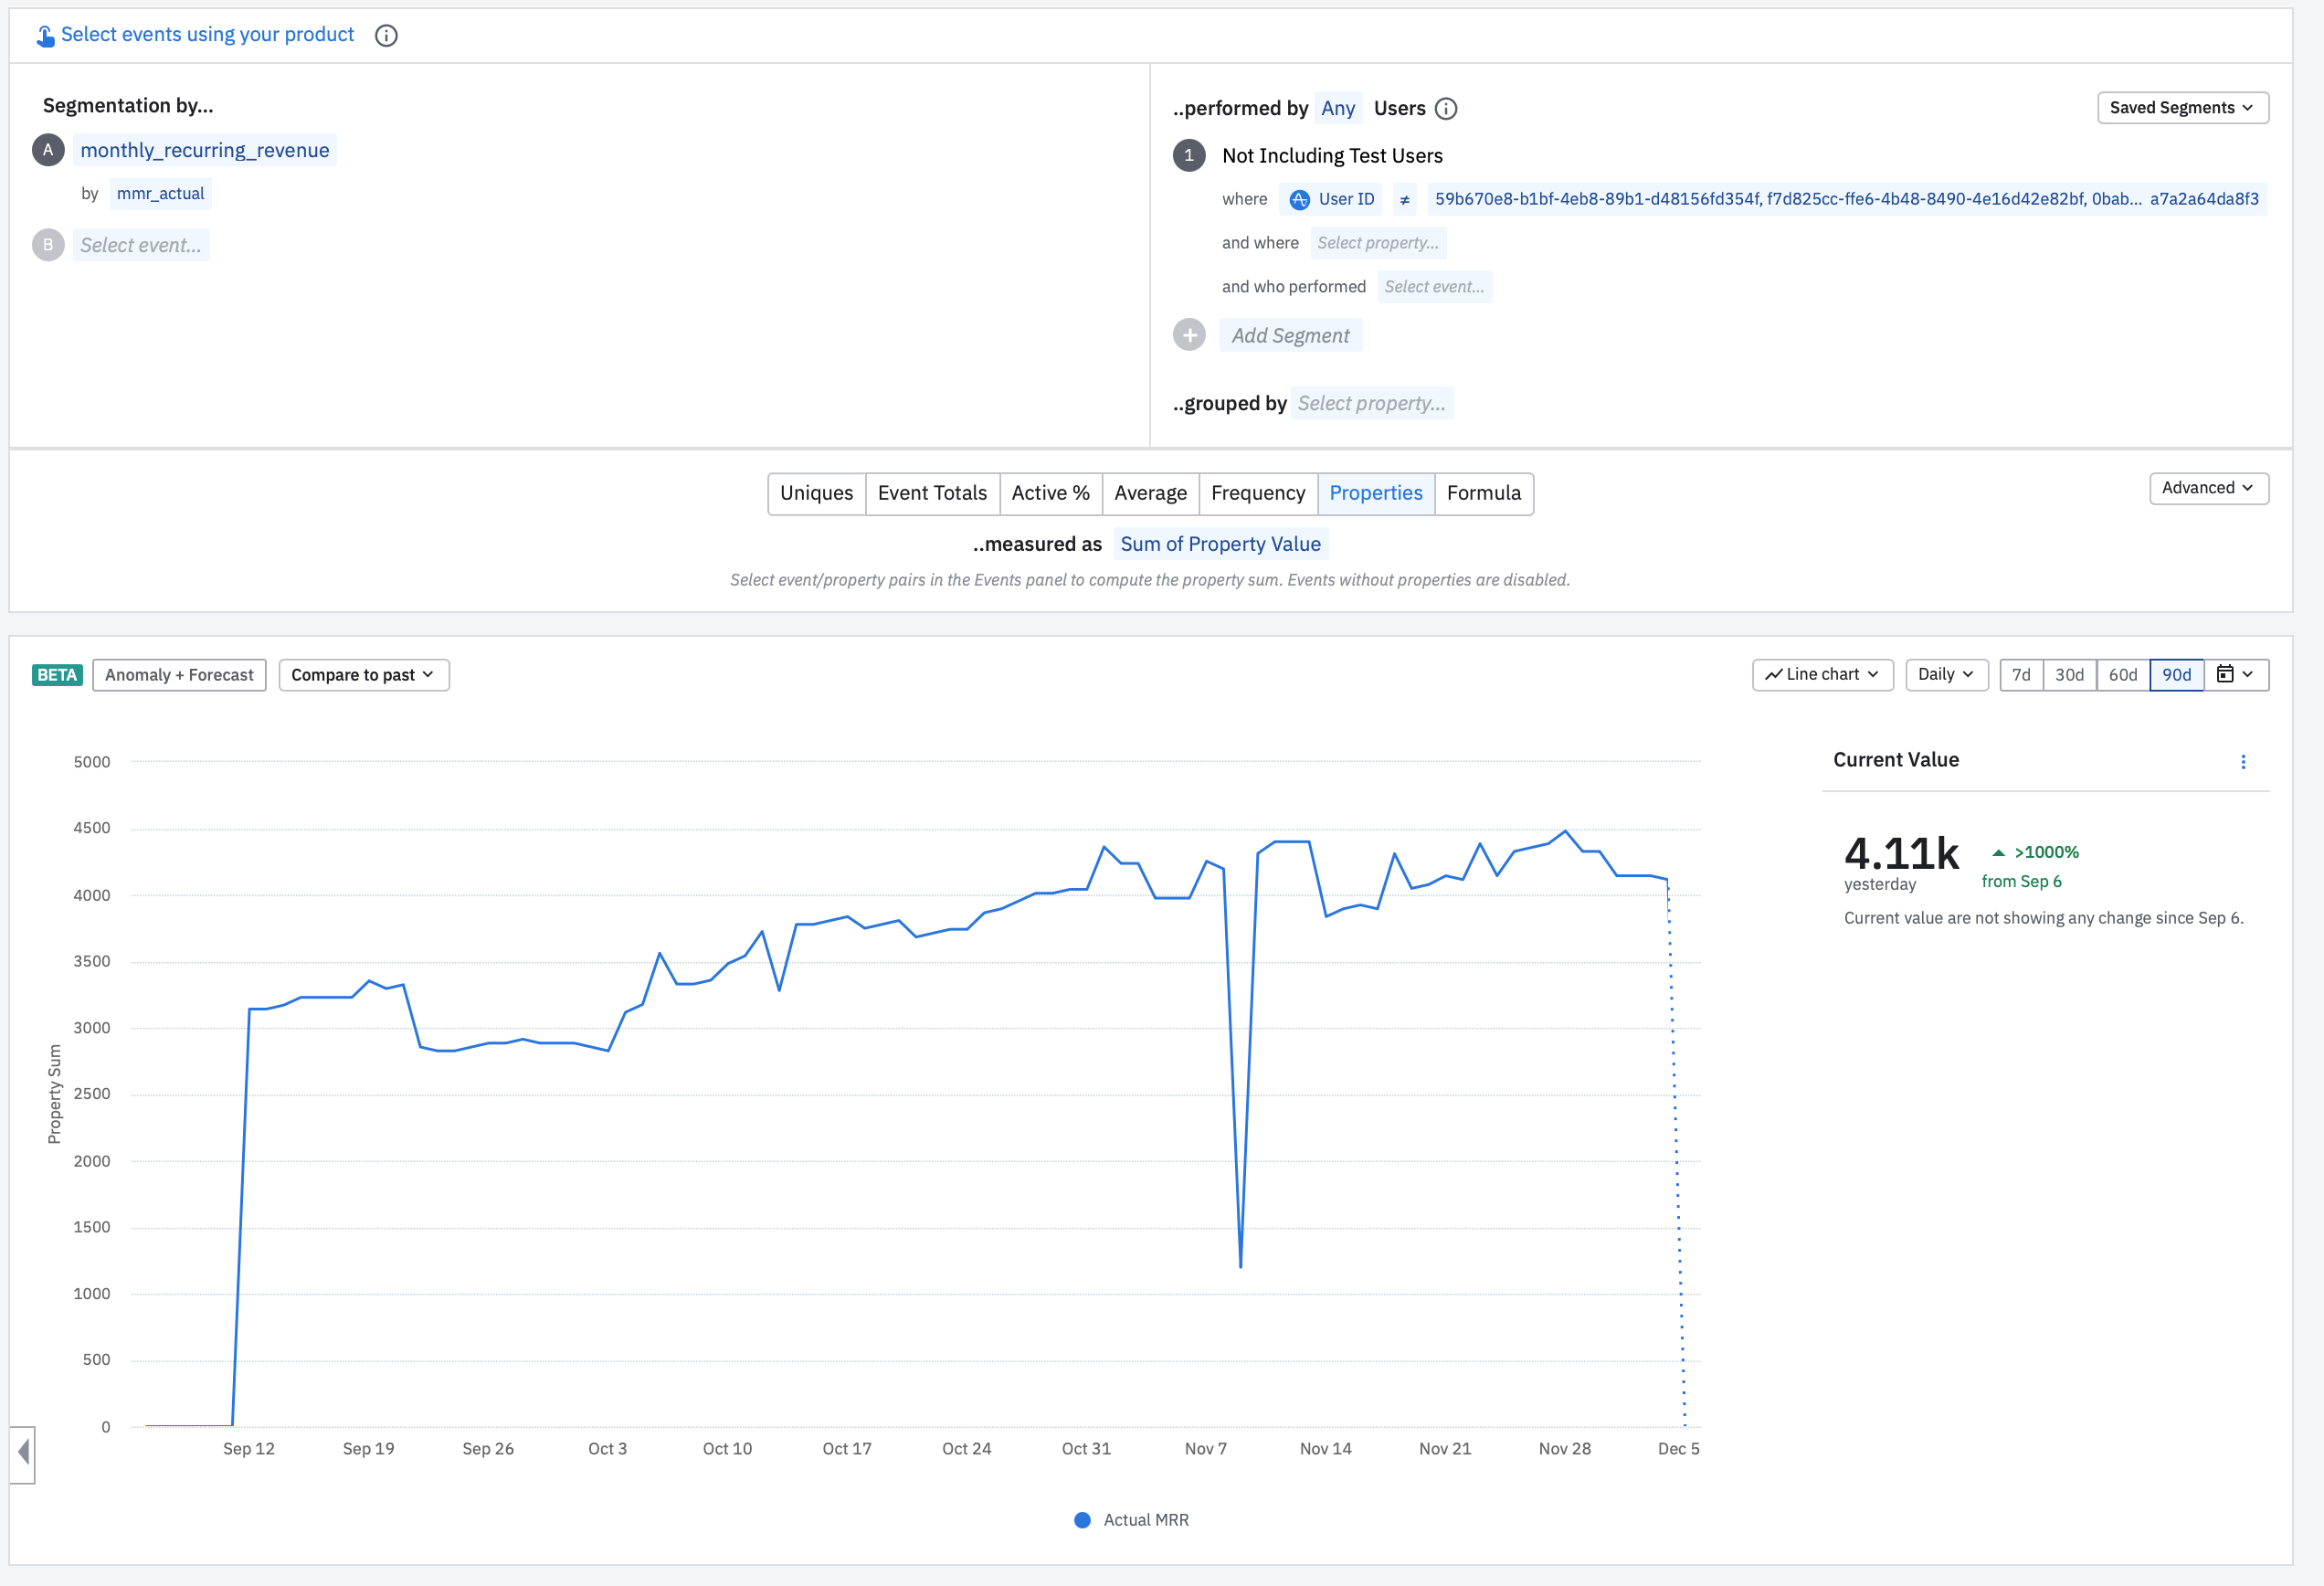
I've a data source that gives me the revenue for each unique user every day. Today, I have a graph showing the sum of this property daily for the last 30 days. 

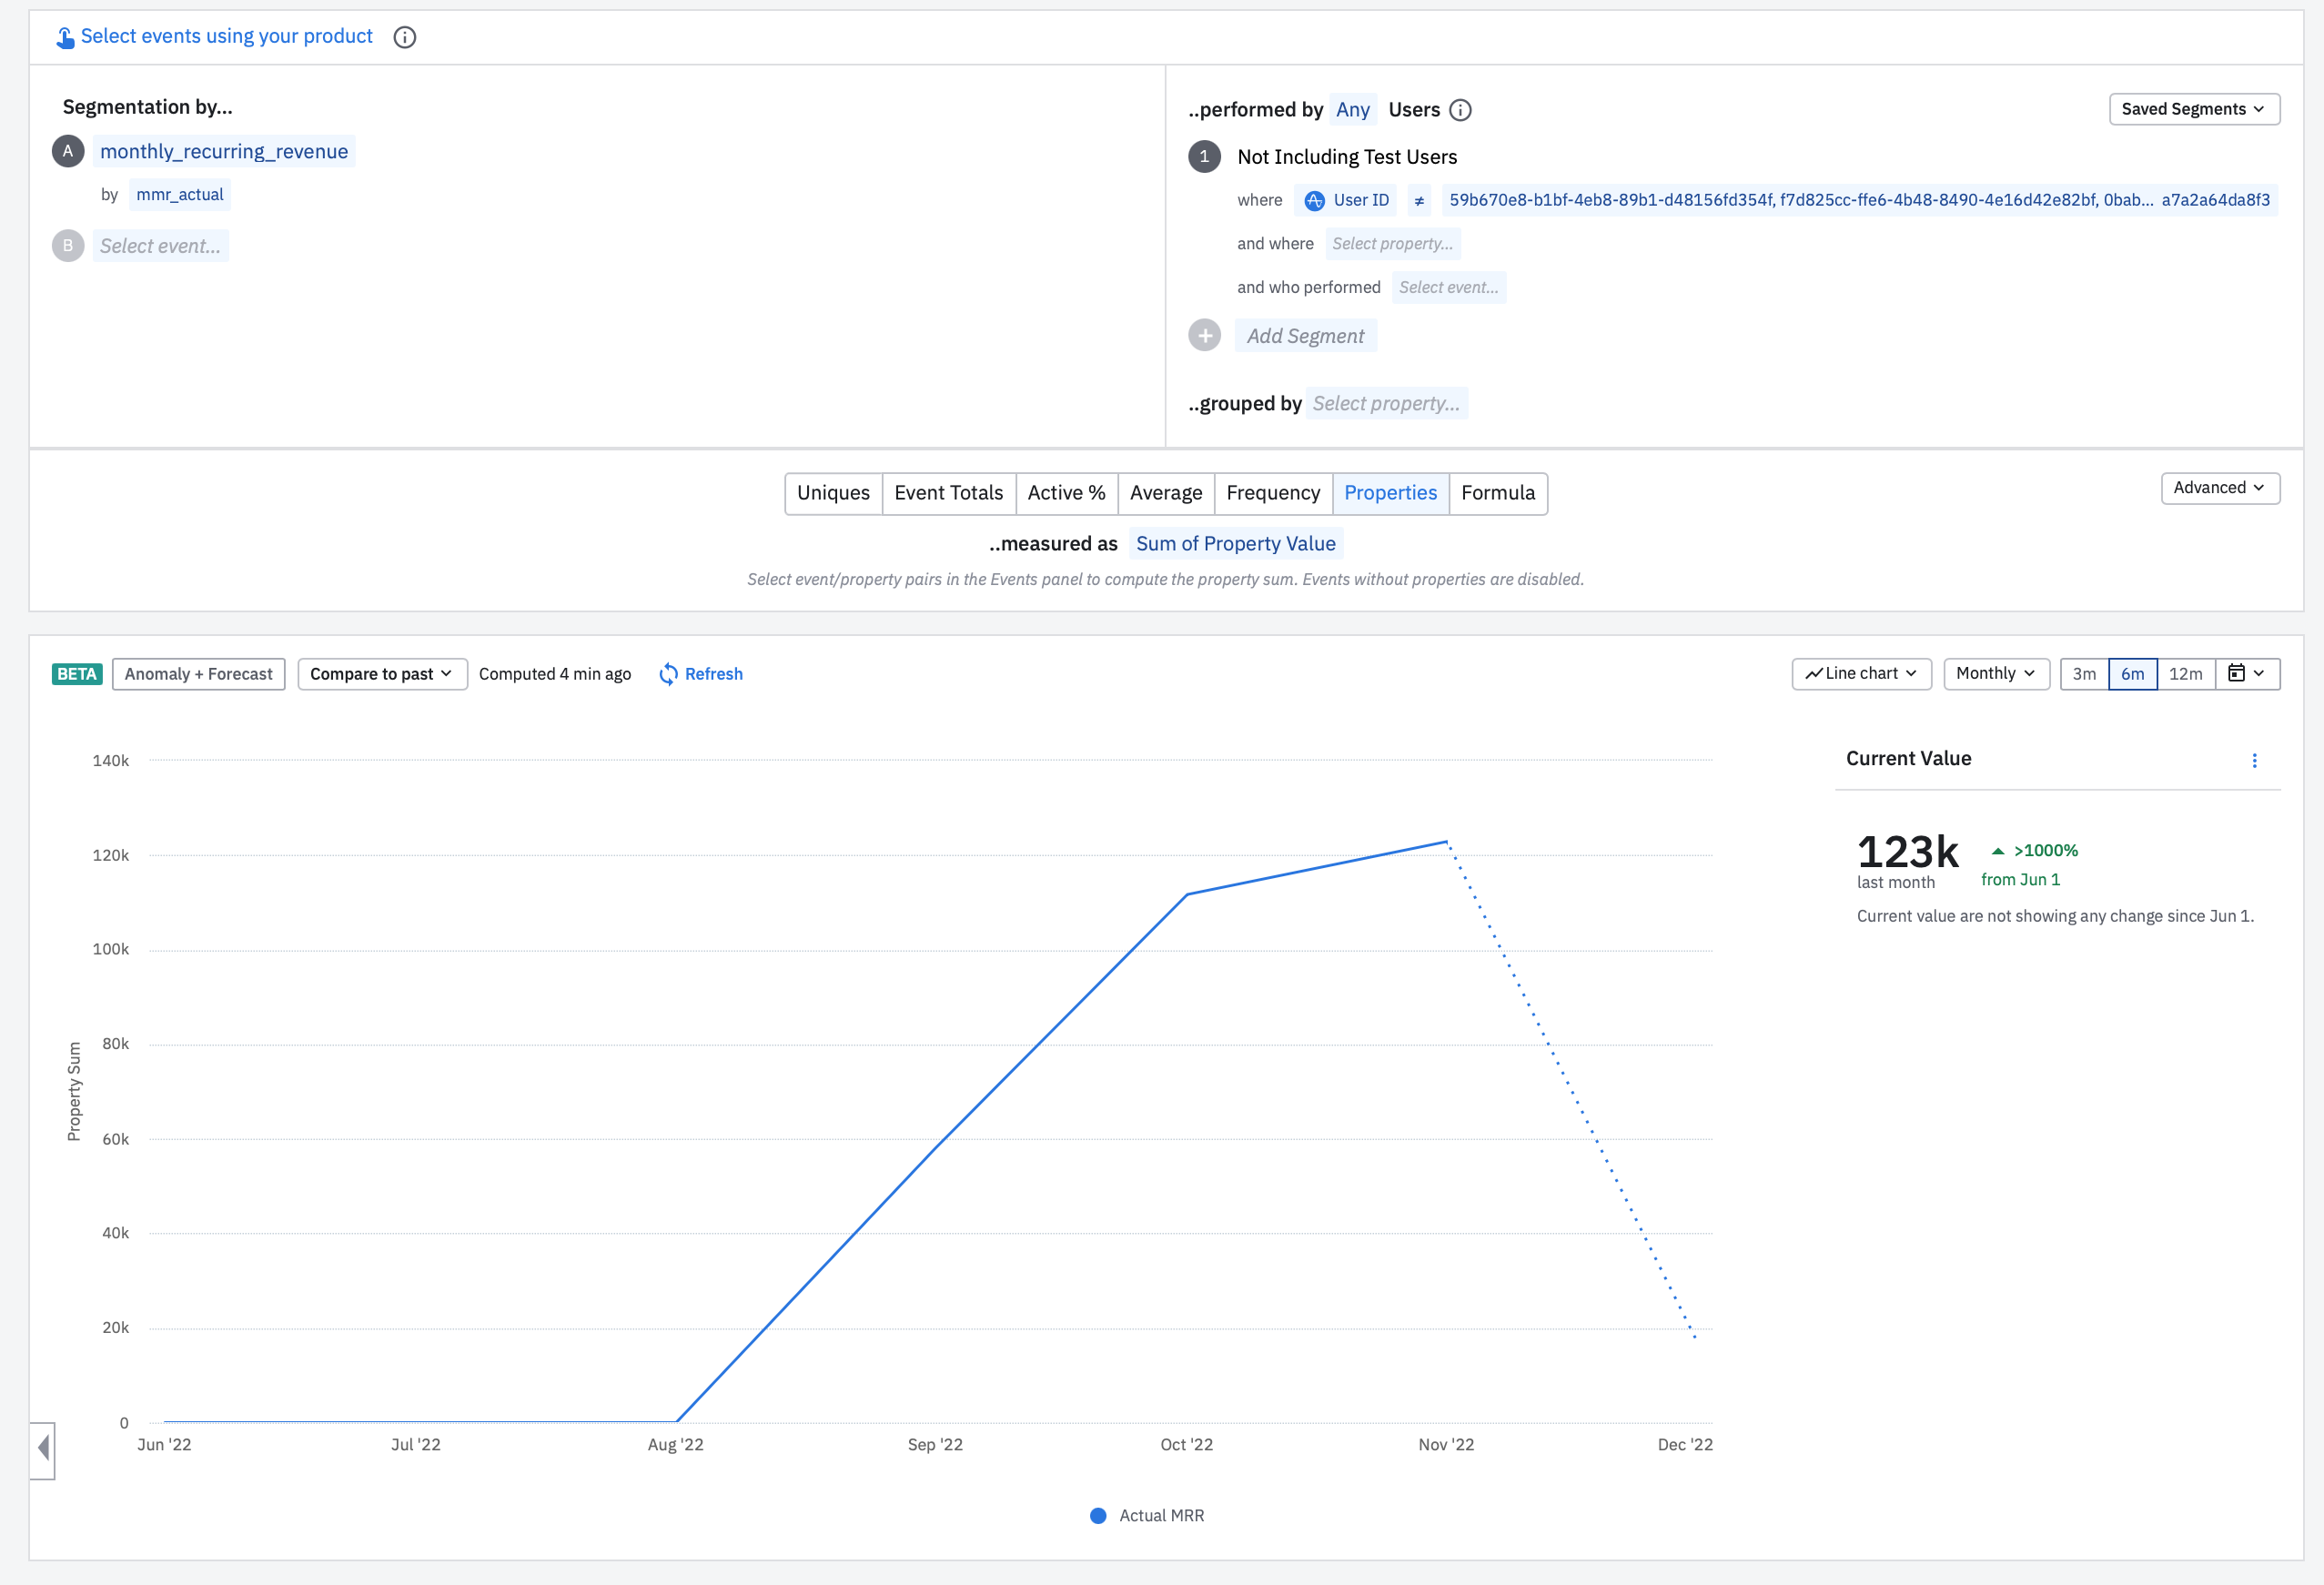
As it's a daily sum, I don't find a way to create a custom formula that helps me to use this data to create a monthly dashboard. When I try to do it, I have a graph that is the sum of the revenue for every user multiplied by the number of days in the month. It's not relevant at all. I would like to have the last daily sum calculated for every month. Can I do it? 

Best, 


icon

Best answer by jmagg 8 December 2022, 01:45

View original

8 replies

Userlevel 5
Badge +6

Hi @qdequele!

Good question. Just to make sure we are on the same page, does your current chart look something like this? Where the custom formula = $:PROPSUM(A).

Do you want the value (sum) for the last day of the month? Or the sum of the revenue across all of the days within a month? If the latter, perhaps this chart is along the lines of what you’re looking for?

Please let me know your thoughts!

Badge

Hello @jmagg


Yes it is looking like `$:PROPSUM(A)`. And yes exactly what I need is the value (sum) for the last day of each month during the last 6 months. 


Best, 

Userlevel 5
Badge +6

Hi @qdequele - thanks for your response! So it seems this chart will show you that:

  • June’s propsum = $3,845,113
  • July’s propsum = $3,760,011
  • August’s propsum = $3,931,893
  • September’s propsum = $3,771,098
  • October’s propsum = $3,736,372
  • November’s propsum = $3,761,138

(for example, August’s propsum value is validated here).

What do you think?

If this is not what you’re looking for, I may be misunderstanding. If this is the case, would you please clarify for me?


Badge

Thanks for your response @jmagg, but it’s indeed not what I expect. 


On the following chart you can see that the MRR is $3000 in September, $4000 in October and $4100 in

November.

So instead of seeing $60k, $100k and $123k on this chart I would like to read the MRR present in the last chart ($3000, $4000, $4100). 


Is it possible? 

Userlevel 5
Badge +6

Hi @qdequele - if I’m understanding correctly, in the first chart, the MRR = $3000 in September, $4000 in October, and $4100 in November. These values are not the sum of all the values across the month (which is what the second chart shows). These values are just the MRR on the last day of each month. Is that what you want - the value on the last day only?

Badge

Yes exactly :)

Userlevel 5
Badge +6

Thank you for letting me know, @qdequele! At the moment, it’s not possible to show the value for the last day of each month on one graph. Here’s an idea to workaround this though - perhaps make a chart for each month (example chart for September) & then add them all to a single dashboard. Also, please feel free to submit this functionality as a feature request to our product team here (as an “Idea”) since this could be beneficial for other customers, too! What do you think?


Userlevel 6
Badge +9

Thank you @jmagg Adding in more info about product feedback in our Community, for reference. Thanks all for participating! 😁


Reply