Solved

Can I create a cohort with users that have performed an action in each day of their first week?

  • 17 May 2021
  • 4 replies
  • 474 views

Badge

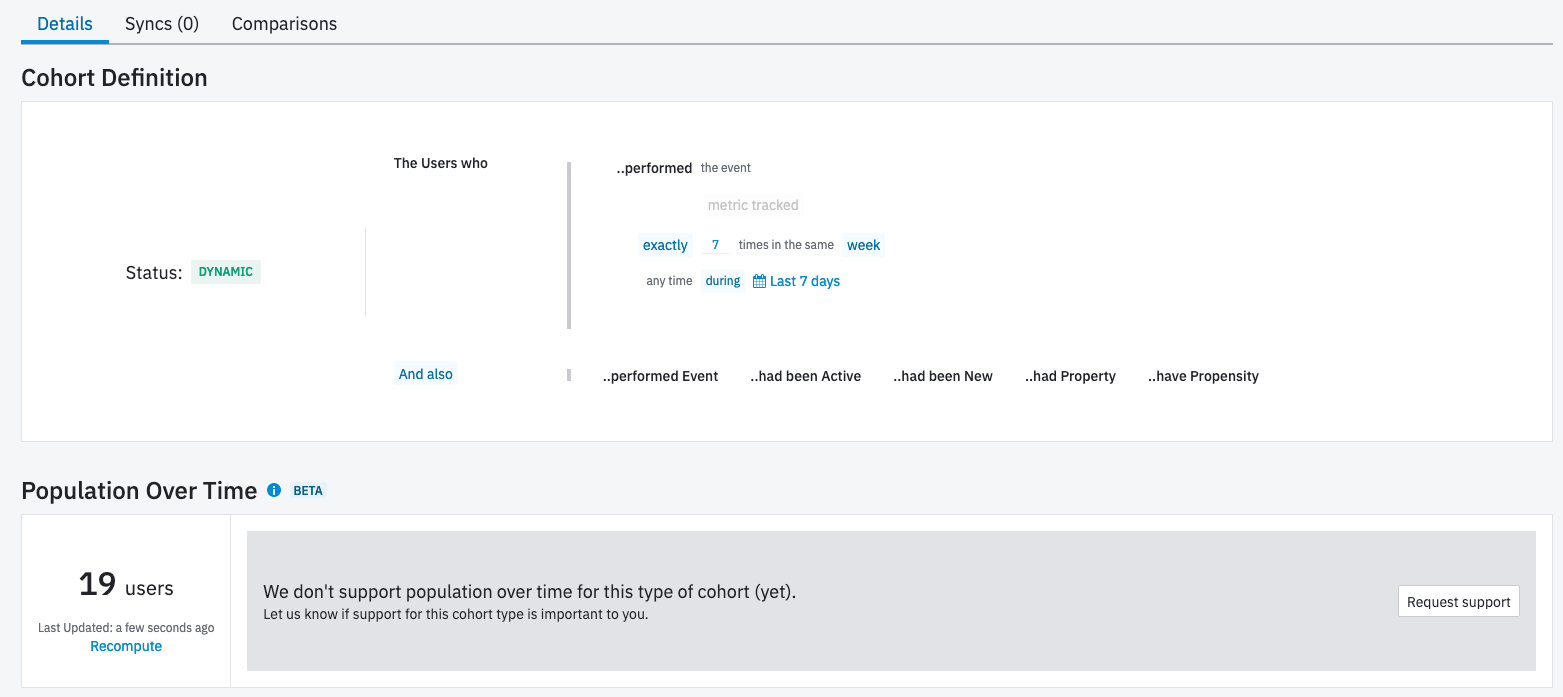
I want to create a cohort for users who have done a particular event, say played song, in 3 different days in their first week. Is there any way to do this?


e.g below, users A and B would be in cohort


user day1 day2 day3 day4 day5 day6 day7 in cohort
A X X - - X - - YES
B X X X - - X - YES
C X - - - - X - NO


icon

Best answer by Saish Redkar 17 May 2021, 18:51

View original

4 replies

Userlevel 7
Badge +10

Hey @seb 
I don’t think we can do that in a straightforward manner using the cohorts feature yet.

But this might be possible using the Stickiness Feature.

More of that in these help center articles - https://help.amplitude.com/hc/en-us/articles/230901928

https://help.amplitude.com/hc/en-us/articles/360053681271-Interpret-your-stickiness-analysis 

Once you have setup the chart correctly as per your use case, you can extract the desired cohort via the Microscope.

Let me know if this works!

Badge

Hi Saish, thats dissapointing. I would expect the feature of x events in x days to be availble for cohorts.


Regarding using the stickyness chart. The resulting cohort uses the following phrase: Users who have performed X exactly/at least x times in the week/month/quarter.


Does that mean that its counting the events, and therefore it considers 7 events in a day the same as 7 events over the a whole week? The wording of the cohort makes me think that this is the case, but the actual number of users seems to indicate its X events in X days.


Could you confirm, that the cohort is measuring X event in X days, rather than the count of events?


cohort:

chart used to create cohort:
[image removed]


Userlevel 7
Badge +10

Hey @seb 

From the cohort you have extracted, it looks like it’s from a non-cumulative stickiness chart as it says “exactly”. As per the docs, “the non-cumulative Stickiness chart shows you the percentage of users who fired the event at least once on the exact number of days listed on the X-axis”

So, if a user performs the event atleast once or multiple times in a single day for exactly 7 days in that week, they would be included in that cohort.

If you choose the number to be exactly “3 days”, then it would include users who perform the event atleast once or multiple times in a single day for exactly 3 days in that week.


Let me know if this makes sense!

Userlevel 4

Hi @seb,

As Saish mentioned, the filter you’re seeing from the cohort generated from your Stickiness chart refers to the exact number of days that your user had returned within the selected time frame. He’s got a great explanation here so I won’t over-elaborate, but I just wanted to provide documentation on this chart as it could be helpful in addition: https://help.amplitude.com/hc/en-us/articles/230901928 

Hope this helps!

Reply