Solved

24 hours of data missing on hourly charts

  • 3 September 2022
  • 2 replies
  • 109 views

Hi there!


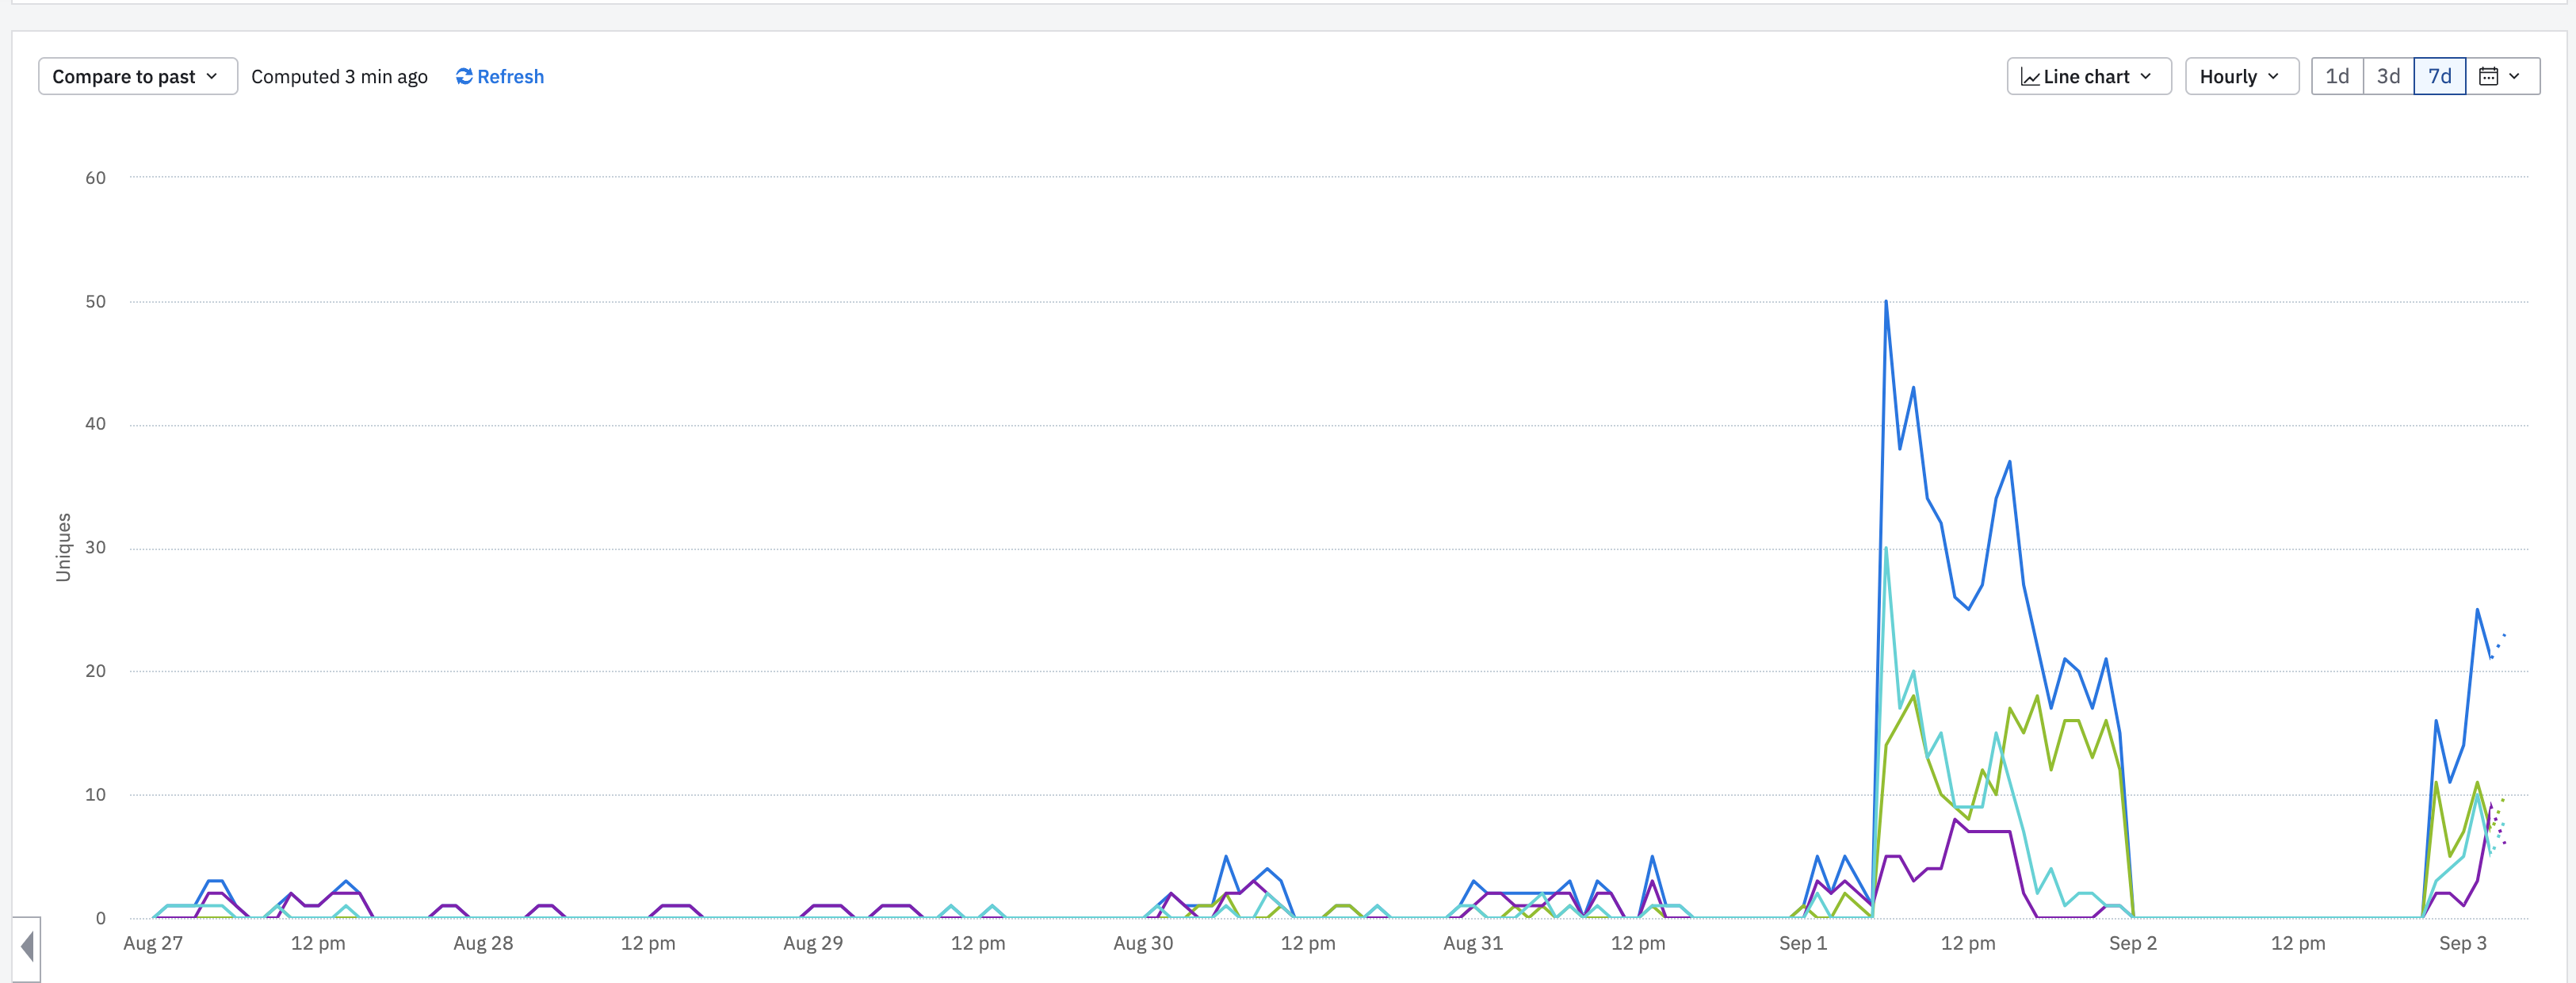
We recently started using Amplitude to collect usage data about our app. On the third day since launch, I ran into a weird issue where a 24-hour period in a segmentation line chart shows zero events, but only when it’s plotted for the past 7 days. Weird as it sounds, if I switch to 3 days, the void in that 24 hour just gets filled. I came back to this a few times today and it looks like the issue happens intermittently - sometimes it just works, sometimes it fails, and because of this unpredictability several of our metrics were disrupted quite a bit.


Service status shows everything’s been normal for the past few days. I wonder what might be the cause for this?


icon

Best answer by jarren.patao 15 September 2022, 19:11

View original

2 replies

Userlevel 4

Hi @khuasw,

It doesn’t appear that we had issues during that time for data processing, however it would still be good to check a couple of things here. A few things I might suggest would be to:

  • Clear your cache
  • Refresh your chart
  • Verify if this behavior is being experienced by other users within your organization

It sounds like there could be caching issues when loading a chart if it is happening intermittently and if it isn’t widespread. Otherwise, hope this helps!

Hi @khuasw,

It doesn’t appear that we had issues during that time for data processing, however it would still be good to check a couple of things here. A few things I might suggest would be to:

  • Clear your cache
  • Refresh your chart
  • Verify if this behavior is being experienced by other users within your organization

It sounds like there could be caching issues when loading a chart if it is happening intermittently and if it isn’t widespread. Otherwise, hope this helps!

Thank you! Looks like it was a temporary issue. I waited for another 2 days or so and have not experienced any glitches since then. 

Reply