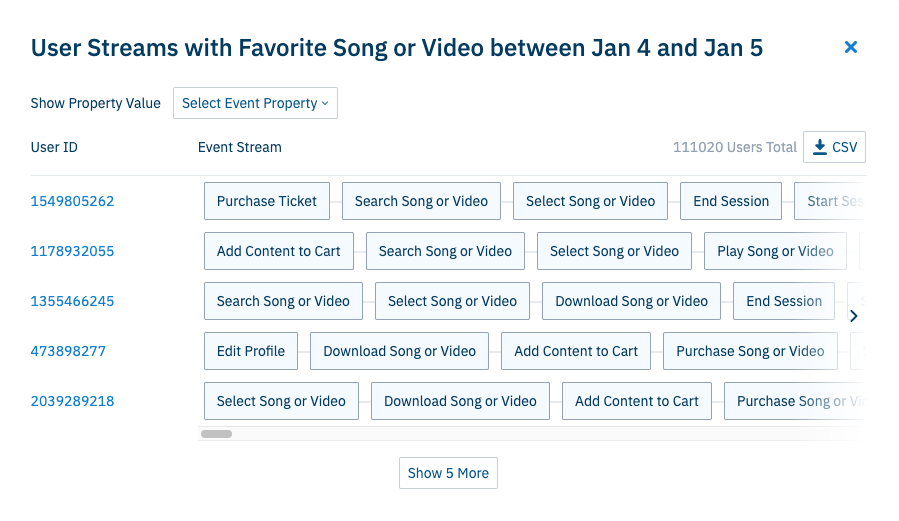
When viewing User Streams from a data point, are there any events taking place in between those streams or does it represent the exact user path?
Hi Nicol Hawkins !
User Streams will show the exact user path, so there will be no events in between the events shown in the stream. There are limits to the stream though and it will not cover a user’s entire event stream. It will show all of a user's events within the date range of the data point and will also show up to 25 events before the beginning of the time range and up to 50 events after the start of the time range. You can read more details on this feature here on our help center.
Hope this helps!
Sydney
Thank you sydney.koh!
Hey sydney.koh,
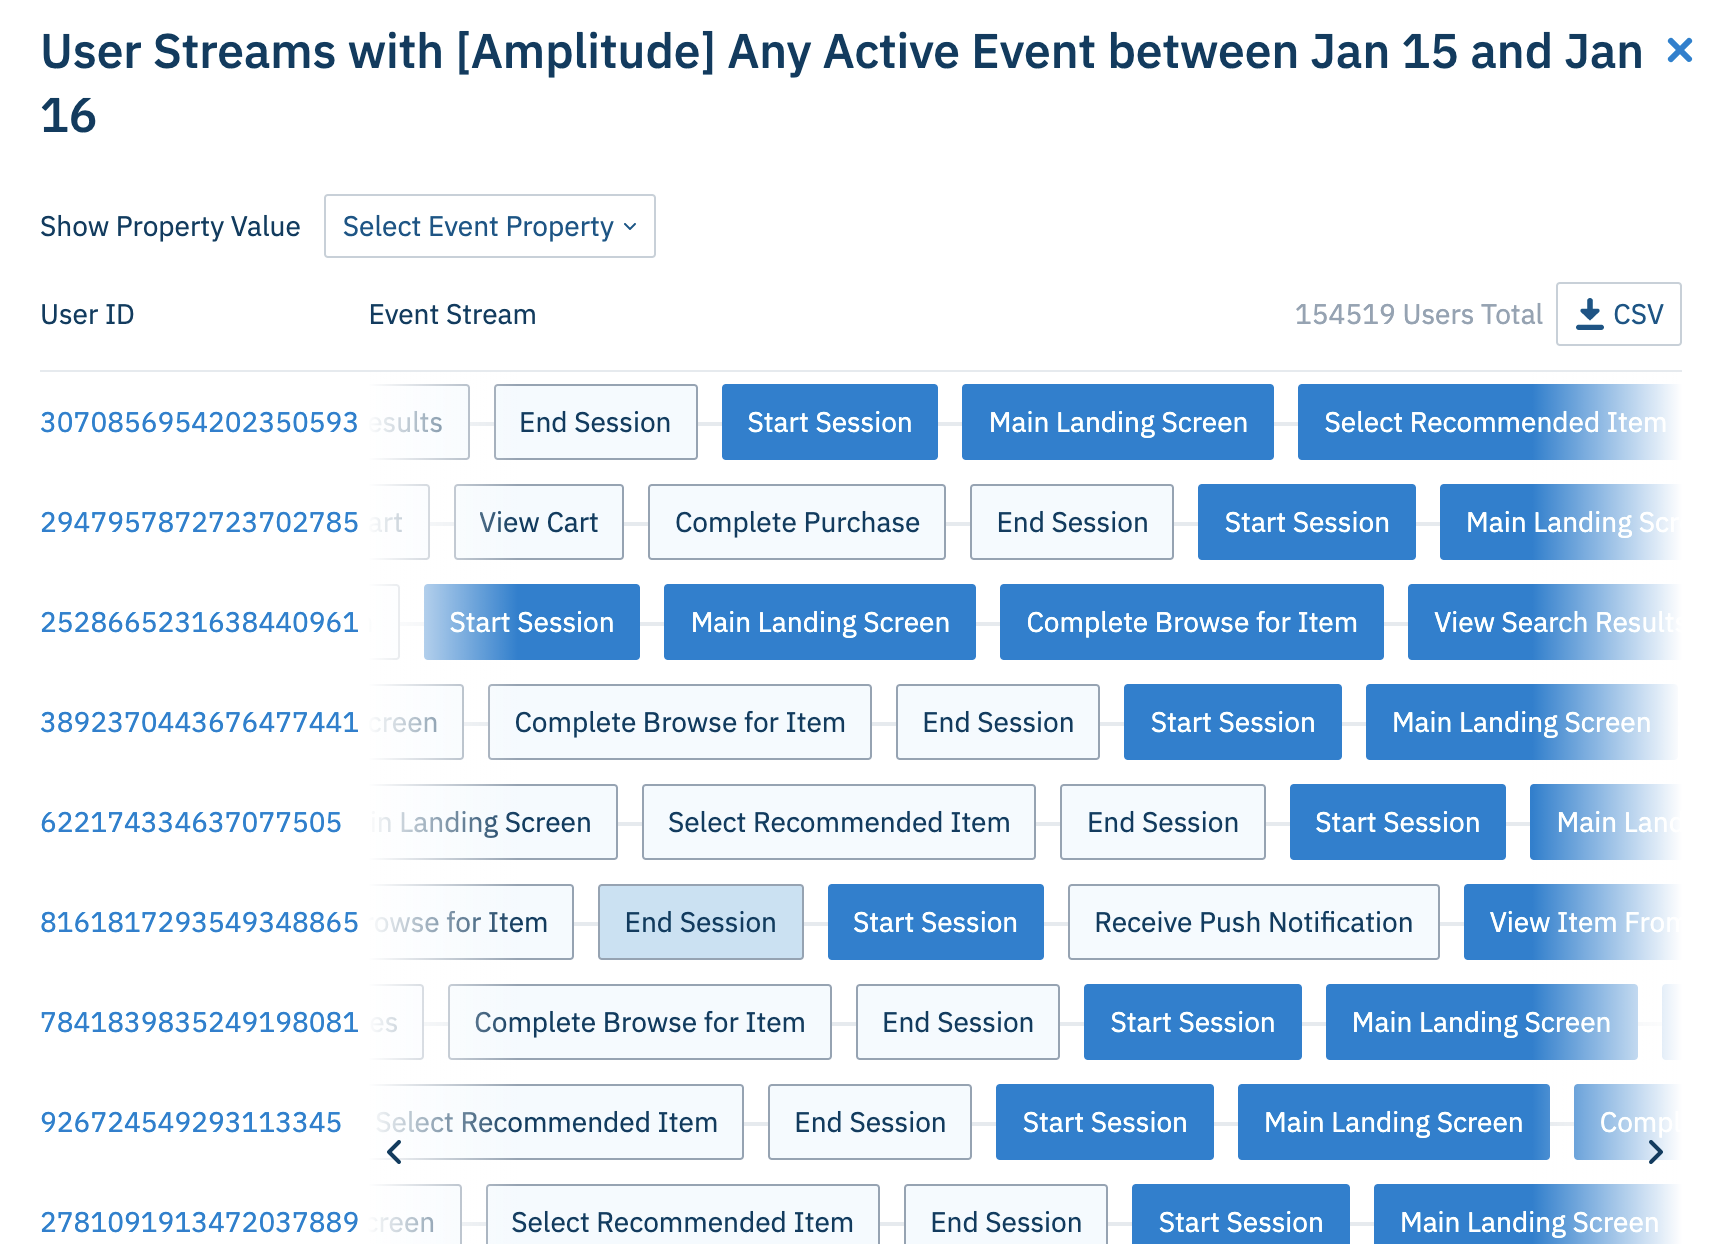
The Microscope article says that “if you have a specific event selected, then the event will be highlighted in the user's stream”.When we build the event segmentation chart using “Any Active Event” instead of a specific event, I see this in the User Streams:
Any idea what’s the criteria for highlighting a bunch of those events? I couldn’t find any specific pattern in the highlighting.
Thanks!
Hi Saish Redkar happy to explain!
The highlighted events in the User Stream will be showing the Active events that are in the data point that you selected. So for example, if you chose the February 4th 2021 data point in your chart the User Stream will highlight the Active events that occurred on February 4th 2021.
Hope this helps let me know if you have any other questions!
Ah! Understood. Thanks for explaining, sydney.koh " src="https://dowpznhhyvkm4.cloudfront.net/2021-02-04-14-58-49-0e9b313439/dist/emojione/1f600.png" width="18" />
Of course anytime!
We implemented first party tracking using the basic JS SDK on the browser and pointing the payload to our servers like this: amplitude.init(AMPLITUDE_API_KEY, { serverUrl: serverUrl, autocapture: { attribution: { excludeReferrers: [/domain1\.com$/, /domain2\.com$/], }, formInteractions: false, fileDownloads: false, }, });…
My Android app is primarily a background app. Does Amplitude track events for such an app? Please let me know.
here is the referance graph: https://app.amplitude.com/analytics/demo/chart/new/363tk5og In this graph, retention is currently being calculated based on the next day, but I want to analyze it based on the previous day instead. Example: For July 27, we should compare retention against July 26, not July 28. * So for 1-day…
Hi everybody! I need your help with a client request: my client is used to analyze landing pages performance with the standard report from GA4 and I need to create something similar in Amplitude. What I already have: * session entries grouped by page URL * purchase event calculated as session totals grouped by page URL and…
Good day! I am new to Amplitude and still learning. Our organization’s current objective is to track specific webpages that have high exits/drop-offs so we think that the Funnel Chart is the best tool to use for it. However, you see our website uses 2 different domains in completing the buying journey of visitors (from…