Solved

avg time from step1 to step 2

  • 9 November 2021
  • 4 replies
  • 268 views

Userlevel 1
Badge +2

Hi, all !!!

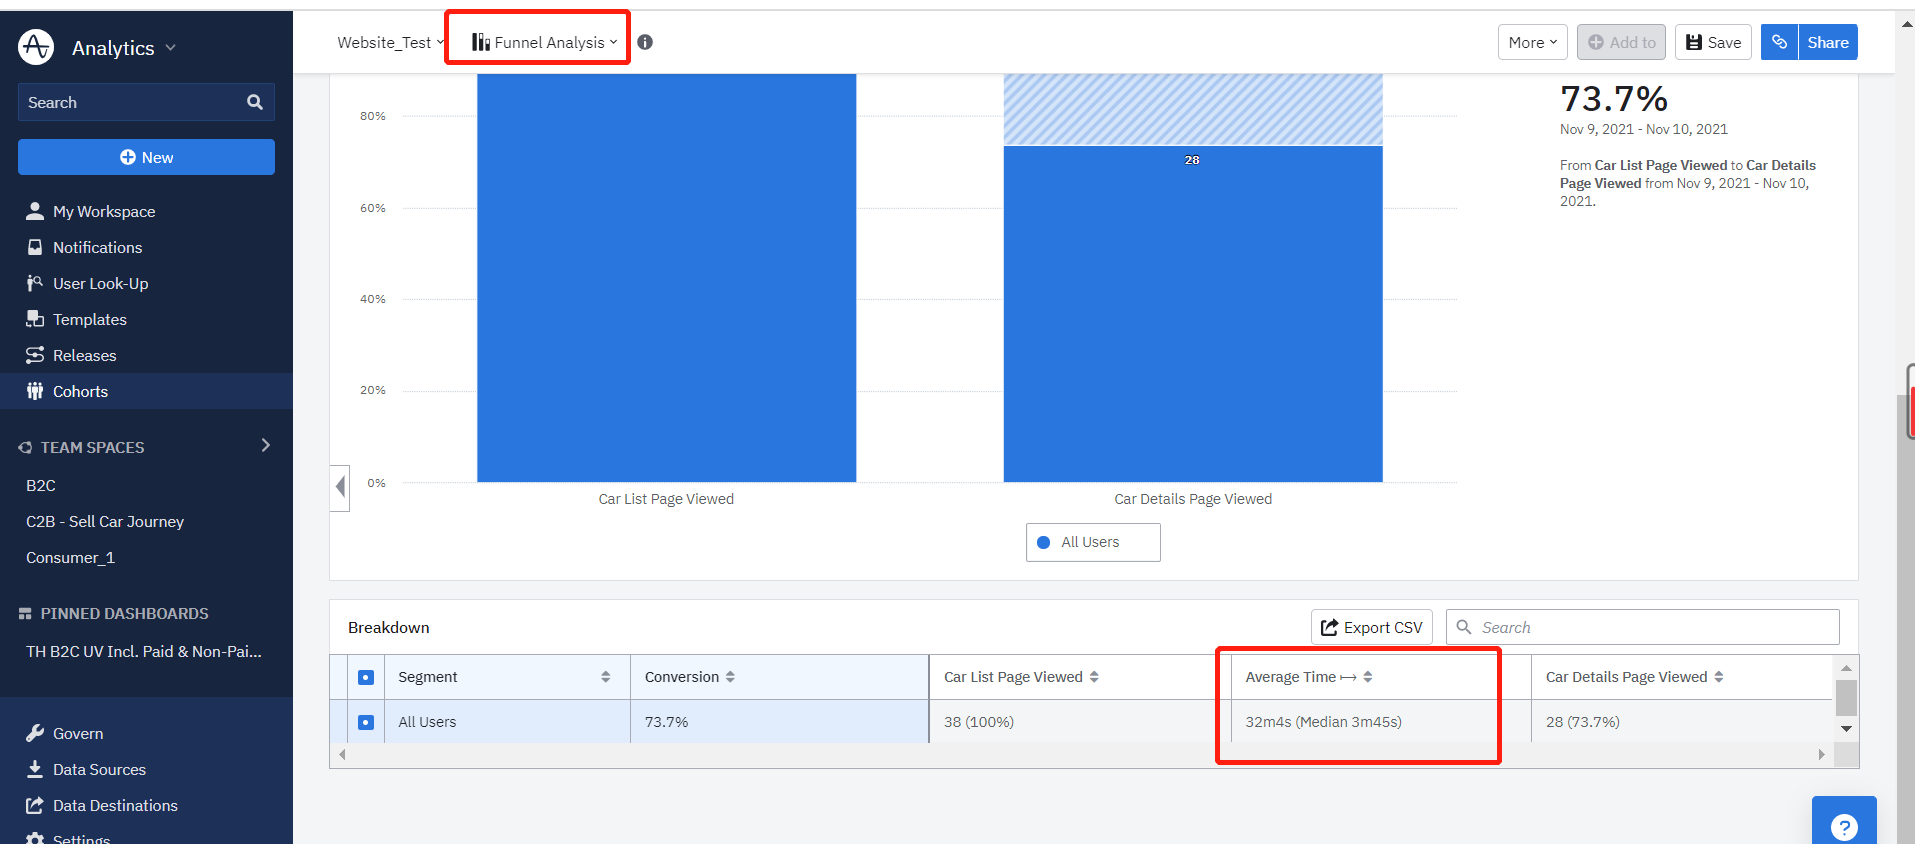
I want to use funnel to check avg time from step1:”event A“ to step 2: ”event B“,

but I don’t know what time between steps is being calculated!

for example:

    user :  eventA  1 - eventB  1 - eventA  2  -  eventB  2

    funnel wiil calculate :

              eventA1- eventB1、eventA1- eventB2、eventA2- eventB2?right?

icon

Best answer by Saish Redkar 10 November 2021, 18:35

View original

4 replies

Userlevel 1
Badge +2

HI, ALL!!!

I think I have figured it out. funnel calculate the user first step1 and first step2.

but I want know that how to see the avg time and Mediantime by day?

I want to see a table about everyday avgtime and mediantime!

maybe you can help me? @Denis Holmes  @Saish Redkar @MikkoKarvonen 

Thank you !!!!


Userlevel 5
Badge +3

but I want know that how to see the avg time and Mediantime by day?

I want to see a table about everyday avgtime and mediantime!


You are on the right track!

You’ll get the daily data by downloading the CSV (click the Export CSV button just above the Breakdown table at the bottom of the screen). It has the breakdown of average and median times (in seconds) on daily level.

Userlevel 1
Badge +2

but I want know that how to see the avg time and Mediantime by day?

I want to see a table about everyday avgtime and mediantime!


You are on the right track!

You’ll get the daily data by downloading the CSV (click the Export CSV button just above the Breakdown table at the bottom of the screen). It has the breakdown of average and median times (in seconds) on daily level.

Thank you !!!   @MikkoKarvonen  

Your answer is great!

but Can we see it without downloading, maybe we can see a trend graph?

Userlevel 7
Badge +10

Hey @xiaomeng.zhang 

The average/median time shown is only available as aggregate for the time period and currently we can’t see a trend graph of those times. You can use the individual average/median time data points from the csv and graph it externally.

You can however visualize the conversion % over time by switching to “Conversion Over Time”.

Reply