I want to illustrate a target value / “corridor” on a segmentation chart. Is there a way to print a static horizontal line at a specific value?
Best answer by JennRu
View original
I want to illustrate a target value / “corridor” on a segmentation chart. Is there a way to print a static horizontal line at a specific value?
Best answer by JennRu
View original
 +9
+9
Hi
 +8
+8
I love that hack!
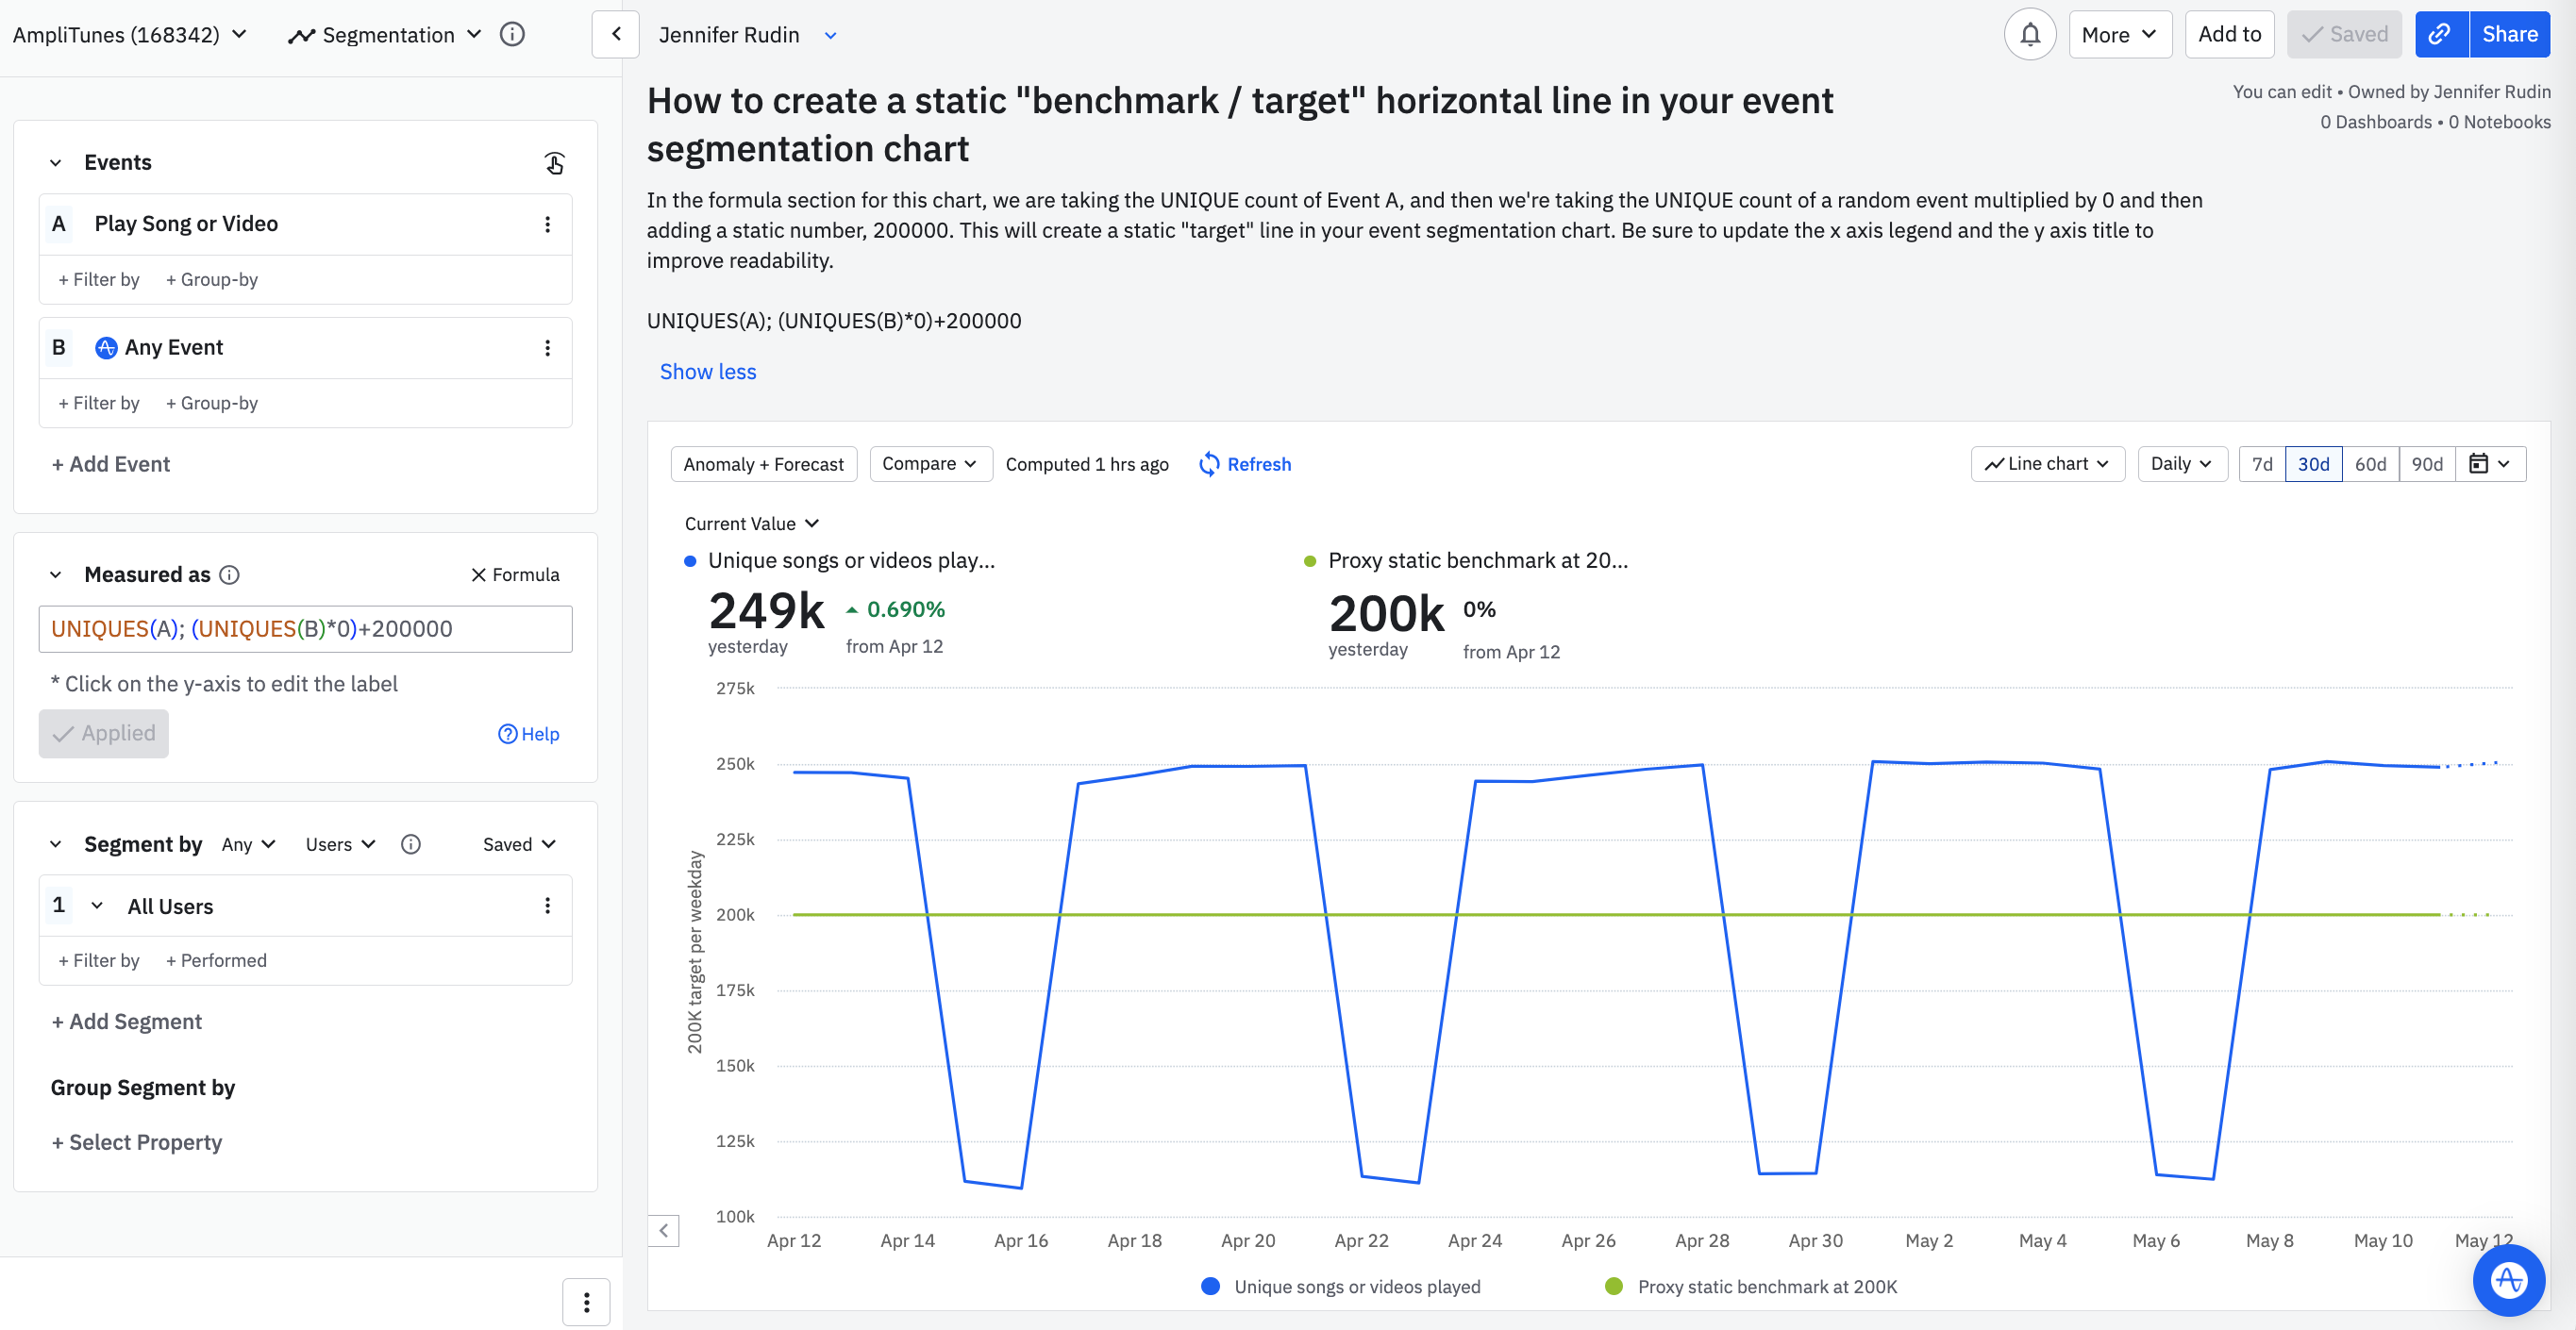
You can see how the formula is referencing a random event (in this case Any Event) multiplied by zero, then adding the specific “target” value to mock this static horizontal line use case.
Thank you both. Seems like quite a workaround, but better than nothing ;)


If you don't have an Amplitude account, you can create an Amplitude Starter account for free and enjoy direct access to the Community via SSO. Create an Amplitude account. You can also create a Guest account below!
If you don't have an Amplitude account, you can create an Amplitude Starter account for free and enjoy direct access to the Community via SSO. Create an Amplitude account. Want to sign up as a guest? Create a Community account.
Enter your username or e-mail address. We'll send you an e-mail with instructions to reset your password.